Flat Roof Solar Calculator: Panel Layout & Energy Output
Estimate flat-roof solar layouts and energy output using roof dimensions, local sunlight and current or speculative efficiencies.

About Rooftop Solar Lab
Explore what your roof could generate, and what better solar technology could change.
DataDeep Rooftop Solar Lab is an interactive flat-roof solar calculator for exploring panel layouts, system capacity and electricity generation. Enter the dimensions of an existing roof or size a roof around your chosen installation. Adjust panel dimensions, module count, spacing and reserved roof area, with metric and imperial measurements and square, rectangular or hexagonal panel geometries.
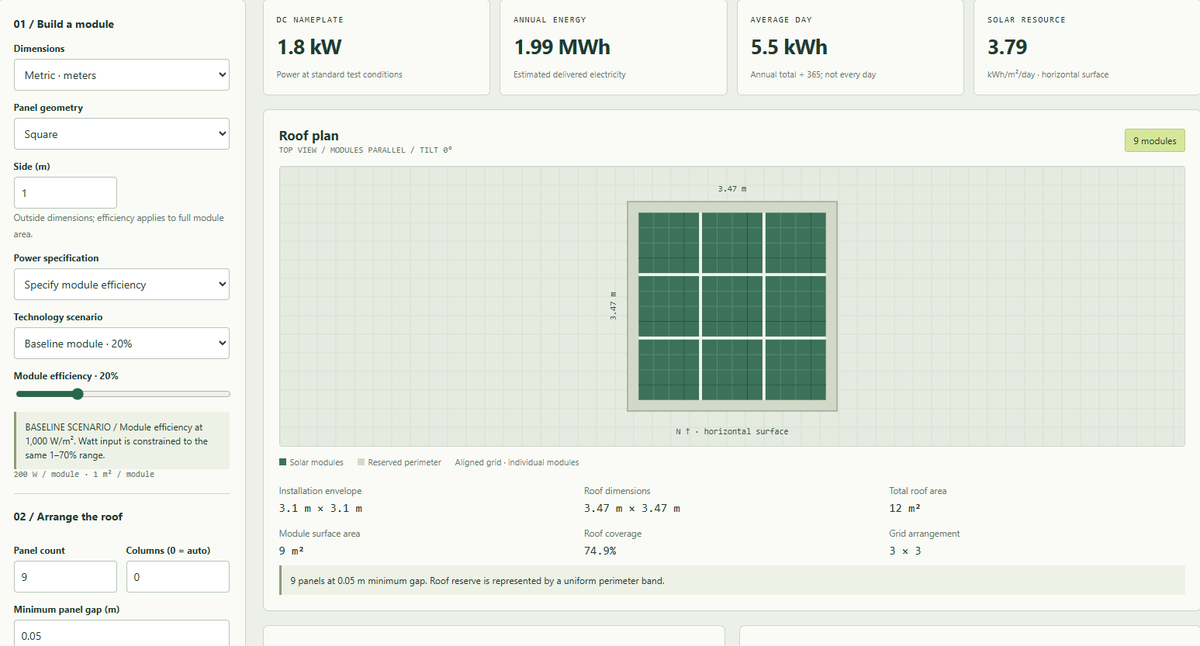
Watch your installation take shape in a top-down roof plan, then explore its estimated power capacity, annual electricity generation, average daily output and monthly production profile. Change the assumptions to see how available space, panel efficiency and energy losses affect the results. Export your configuration and monthly estimates as a CSV for further comparison.
Compare present-day efficiency assumptions with speculative future scenarios. Start with the illustrative 20% module baseline, enter your own panel specifications, or explore higher-efficiency assumptions inspired by tandem and multijunction solar research. The calculator’s 30%–70% scenarios are explicitly speculative for this rooftop model: they show how changing whole-module efficiency affects the estimate, not whether a particular technology can achieve that performance. The highest settings are extreme sensitivity tests, not validated engineering targets.
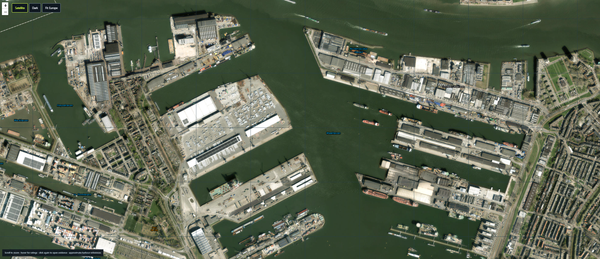
Choose a location using the map, coordinates or city shortcuts. Use embedded NASA POWER sunlight climatology for selected cities, request NASA data for another location, enter your own annual-average sunlight value, or experiment with the clearly labelled offline approximation. The standalone tool runs in your browser without installation; optional NASA requests require an internet connection.
Designed for exploration and preliminary estimates. The model assumes fixed, horizontal panels without tracking. It does not model shading, snow accumulation, structural loading, battery storage or site-specific safety requirements, and it is not a substitute for professional solar-system design.
Rooftop Solar Lab
Roof plan
Choose a location
CLICK THE MAPA year on this roof
Monthly numbers
| Month | GHI / day | Energy / kWh |
|---|
How the estimate works
DC kW = total module area × efficiency × 1 kW/m². Delivered kWh = DC kW × equivalent peak-sun hours × (1 − losses).
For horizontal panels, global horizontal irradiation (GHI) is used directly. A value of 4 kWh/m²/day corresponds to 4 equivalent full-sun hours—not 4 hours of daylight.
Gaps do not generate power. Hexagons use their actual polygon area and an aligned rectangular bounding-box grid, not optimized honeycomb packing.
These are screening estimates, not construction, structural, financial or electrical-design advice. No shading geometry, snow accumulation, roof load, fire lanes, battery storage, grid limit or degradation model is included. Flat mounting needs drainage and soiling review.
Technology frontier
Efficiency is a whole-module, unconcentrated sunlight assumption in this simulator. Shape does not establish commercial availability. Future presets are sensitivity scenarios, not product claims or forecasts.
20–29.9% / Baseline to ambitious
20% is the default illustrative module efficiency. Higher values require a matching real product specification; a laboratory cell result is not a rooftop module rating.
30–49.9% / Future module scenarios
Tandem perovskite/silicon, III–V multijunction, and perovskite/III–V/Si stacks motivate exploration. All ≥30% presets are labeled speculative for this general rooftop installation.
50–70% / Speculative sensitivity tests
Intermediate-band absorbers, quantum-dot multiple-exciton generation, hot-carrier extraction, photon conversion, 2D van der Waals and moiré structures are research concepts—not demonstrated modules at the selected values. 70% is an extreme arithmetic test, not a validated achievable target.
Optical spectrum splitting and concentrator records are not modeled. Adding mechanisms does not automatically add their theoretical efficiency gains.
Sources & model provenance
NASA POWER climatology API: eight embedded city datasets (2001–2020 climatology, retrieved September 19, 2026), plus optional online point query for ALLSKY_SFC_SW_DWN, renewable-energy community, kWh/m²/day. Validated monthly values replace the offline estimate only after a successful response. The response period and retrieval time are shown when available. No credentials required; selected coordinates are sent to NASA only when you press the load button.
FAO-56, extraterrestrial radiation: offline daily solar-geometry equation, summed over a non-leap year, multiplied by the selected constant atmospheric transmission. This is not a validated local irradiance dataset, and does not model regional cloud, aerosol or elevation effects.
Fraunhofer ISE, 2022 research milestone: four-junction cell at 47.6% under 665-sun concentration. This historical result is not a 47.6% fixed, one-sun rooftop module and is not asserted to be the current record.
Research concepts supplied in the project brief guide the scenario descriptions. Their individual performance limits and commercialization dates are not adopted as verified model inputs. Version 1.0 · September 2026. Map: original schematic linework; not for navigation.