
Mineral Depletion: Reserves and Recycling Across 16 Materials
Explore reserves, recycling, dissipation and 100-year extraction scenarios for 16 materials, including copper, lithium, silver and helium.

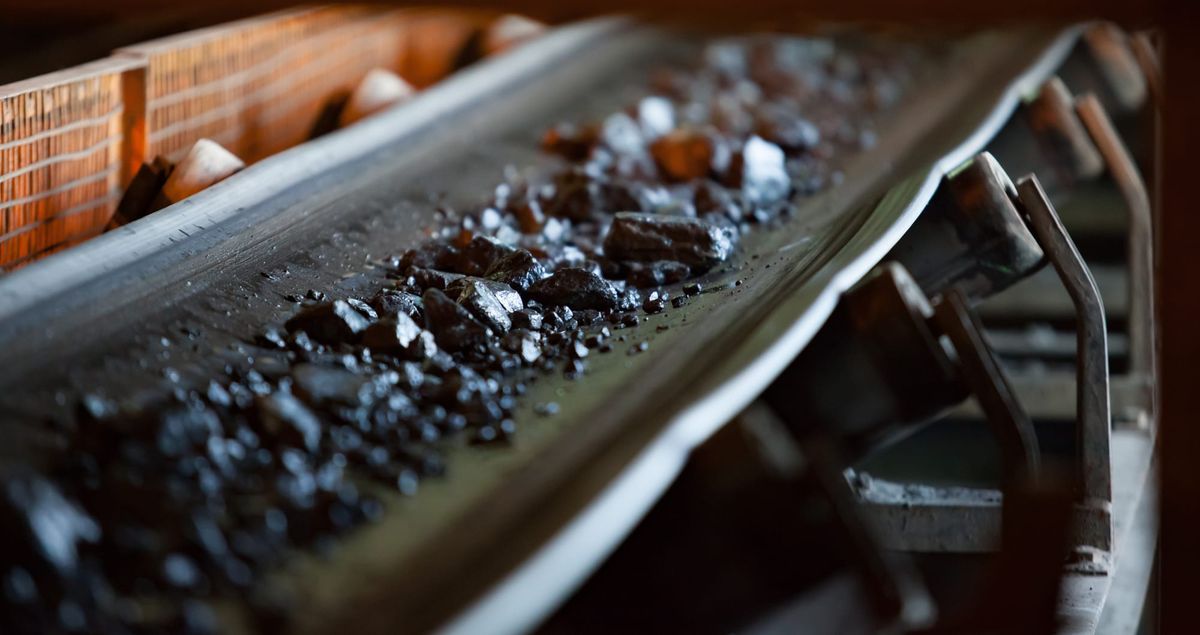
Finite Materials Are Not a Countdown.
Depletion pressure, dissipation, and anthropogenic stocks across 16 nonrenewable materials
The public debate over mineral depletion often begins with a seemingly straightforward calculation: divide reported reserves by annual production, convert the result into years, and treat the answer as a countdown. That approach is intuitive, but frequently misleading. Reserves are neither a fixed measure of everything in the ground nor a forecast of when production will stop. They are an economic and technical subset of broader resources, shaped by prices, exploration, engineering, permitting, recovery technology, and reporting conventions [1][2].
This report reframes the problem. Instead of asking which material will be “used up” first, it compares 16 finite materials along three different dimensions:
1) the size of the currently reported reserve inventory relative to annual primary output;
2) the degree to which use disperses material or makes it difficult to recover;
3.) the physical scale of annual material throughput
The result is a map of how different resource systems come under pressure, and of where intervention can preserve future supply.
The interactive graphical figure below uses reported reserves divided by annual primary production on the horizontal axis, an irreversibility and dissipation screening index on the vertical axis, and annual contained-element throughput for bubble area [1].
A 16-material comparison of reserve pressure, dissipative use, recoverability, and the century-scale shift from geological resources to anthropogenic stocks.
Nonrenewable resource depletion, dissipation, and anthropogenic stocks
Sixteen materials compared through geological inventories, primary throughput, recovery pathways and century-scale extraction pressure.
R/P is an inventory ratio, not an exhaustion date. Y is an analyst screening index, not a measured percentage lost. Missing data remain missing.
Reported baseline
Nine comparable reserve proxies are shown. The remaining seven materials retain complete qualitative profiles and explicit inventory gaps. Native rock and gas units are preserved here.
| Material | Annual production | Reported reserves | R/P years | Y index |
|---|---|---|---|---|
| Helium | 190 million m3 He at 15 C and 101.325 kPa/year | Not verified m3 He at 15 C and 101.325 kPa | Not verified | 91.2 |
| Silver | 26,000 t Ag/year | 610,000 t Ag | 23.5 | 50 |
| Tin | 290,000 t Sn/year | >6 million t Sn | >20.7 | 60 |
| Antimony | 110,000 t Sb/year | >2 million t Sb | >18.2 | 75 |
| Zinc | 13 million t Zn/year | 240 million t Zn | 18.5 | 50 |
| Tellurium | 1,000 t Te/year | Not verified t Te | Not verified | 58.8 |
| Indium | 1,100 t In/year | Not verified t In | Not verified | 77.5 |
| Germanium | Not verified t Ge/year | Not verified t Ge | Not verified | 68.8 |
| Gallium | 900 t Ga/year | Not verified t Ga | Not verified | 77.5 |
| Rhenium | 81 t Re/year | Not verified t Re | Not verified | 25 |
| Tungsten | 85,000 t W/year | >4.7 million t W | >55.3 | 35 |
| Phosphorus / phosphate rock | 250 million t phosphate rock/year | 73 billion t phosphate rock | 292 | 85 |
| Fluorspar / fluorine | 10 million t fluorspar/year | 330 million t fluorspar | 33 | 85 |
| Copper | 23 million t Cu/year | 980 million t Cu | 42.6 | 25 |
| Lithium | 290,000 t Li/year | 37 million t Li | 128 | 50 |
| Uranium | 61,924 t U/year | Not verified t U | Not verified | 42.5 |
Production: 2025 USGS estimates, except uranium 2024 NEA/IAEA. Lithium excludes US output. > values are lower bounds. Source details are within each profile.
Interpretation
Helium requires capture before venting. Phosphorus and fluorine face diffuse-use losses. Specialty metals depend on host minerals and installed recovery. Copper and lithium combine large or growing throughput with useful future secondary stocks. Tungsten and rhenium retain valuable industrial scrap. Uranium requires a distinct treatment of fission, tails and used fuel.
2050 demand and century scenarios
IEA STEPS: 37 Mt/year refined Cu (excluding direct-use scrap), 1.16 Mt/year Li. BHP: >50 Mt/year broader Cu demand. NEA/IAEA: 84,800–143,900 tU/year reactor requirements. These product boundaries differ. Published 2050 mass projections remain unverified for 13 other materials.
The three common scenarios hold primary output constant, reduce it to 0.75× by 2050 then decline 0.5% annually, or increase it to 2× by 2050 then hold it flat. They yield 68.64, 100 and 187.5 current-output years through the start of 2126. They are stress tests, not calibrated material forecasts or probabilities.
Material profiles
Open a profile for all requested fields, quantified evidence, scenario totals and quality ratings.
Helium He · overall evidence C
Venting and gas-system constraint. Critical capture-before-release opportunity; a global R/P ranking is unsupported. [USGS_He] [ETH26]
Annual primary output
190 million m3 He at 15 C and 101.325 kPa/yearIncludes Canadian-origin helium purified in the US; world series is not a pure mine-withdrawal measure. Gas reference conditions and mass conversion are USGS footnote 1. [USGS_He]
reported helium production/sales
Reserves
Not verified m3 He at 15 C and 101.325 kPaUSGS global reserves NA; US table includes recoverable-resource estimate. Global identified resources must not be relabeled reserves. [USGS_He]
Reserve-life proxy
Not verified yearsUSGS global reserves NA; US table includes recoverable-resource estimate. Global identified resources must not be relabeled reserves. [USGS_He]
Broader resources
identified recoverable geological resources
39.8 billion m3 HeDerived 8.49 billion US + 31.3 billion elsewhere; not annual production or reserves. [USGS_He]
2050 demand
No comparable published projection verified.Separate 0.75×, 1× and 2× sensitivities are included in the dataset. For materials without measured current demand, these use primary output as an explicitly labeled primary-equivalent proxy.
Cumulative primary extraction-equivalent, 2026 to start-2126
| Conditional case | 2050 primary output | 100-year cumulative |
|---|---|---|
| conservation | 142 million m3 He at 15 C and 101.325 kPa/year | 13 billion m3 He at 15 C and 101.325 kPa |
| constant | 190 million m3 He at 15 C and 101.325 kPa/year | 19 billion m3 He at 15 C and 101.325 kPa |
| expansion | 380 million m3 He at 15 C and 101.325 kPa/year | 35.6 billion m3 He at 15 C and 101.325 kPa |
Recovered primary output, not all ore moved; no future secondary flow counted as newly extracted. For Ge only normalized scenario indices are available.
Recycling
Comparable current global EOL rate: not verified. The following metrics retain their own denominators and dates.
closed loop reuse
85 percentInstitutional reuse, not global EOL recycling rate. [ETH26]
Dissipative use and retained stocks
Global dissipative share and current retained-stock fraction: not quantified.
Venting transfers recoverable reservoir helium to extremely dilute air; capture before release is much easier than atmospheric recovery. Closed cryogenic loops retain an operating inventory; lifting, purging, leak testing and uncollected boil-off lose economic concentration. [USGS_He] [ETH26]
17 percentLifting-gas use, not measured global venting share. [USGS_He]
Byproduct/coproduct dependency
Gas reservoirs and gas-processing infrastructure dominate supply; dedicated nonhydrocarbon helium projects can reduce dependence on natural-gas sales. [USGS_He] [ETH26]
Substitutability
No practical substitute for the lowest-temperature liquid-helium applications; cryocoolers reduce makeup needs. Other gases substitute for selected lifting, shielding and inerting uses. [USGS_He] [ETH26]
Ore-grade trend
No global concentration time series verified. Reservoir He concentration and gas flow govern economics; declining gas output can strand helium irrespective of remaining gas-in-place. [USGS_He] [ETH26]
Geographic production and refining concentration
Production: United States; 42.6%
Calculated from rounded table values; same caveats as production. Re location is recovery country including imported residues; He US includes Canadian feed; Te/Li denominators omit output. [USGS_He]
Refining: Not verified; Not verified%
Do not infer refinery shares from mine shares.
Reserve additions / resource conversion
Nonhydrocarbon discoveries, capture at existing gas plants, storage and reliquefaction can expand available supply. No defensible century-scale addition forecast. [USGS_He] [ETH26]
No verified global century-scale addition forecast. Dataset scenario gaps are required conversion, not predicted discoveries.
Visualization and confidence
Y = 91.2; sensitivity 66.2–100. Components: {'dispersion_exposure': 4, 'recovery_barrier': 3, 'loss_of_economic_recoverability': 4}. Analyst judgment; no measured loss percentage.
32,195 t element/yearUSGS footnote: 27.737 m3 at 15 C, 101.325 kPa = 0.0047 t. Volume not liquid volume. [USGS_He]
| Field | Evidence grade |
|---|---|
| annual production | B |
| reserves | D |
| resources | B |
| recycling | C |
| dissipative share | D |
| anthropogenic stock mass | D |
| ore grade trend | C |
| 2050 demand | D |
| century extraction | D |
| reserve conversion | D |
| Y score | C |
| overall | C |
A=direct authoritative quantified estimate; B=bounded/partial estimate or source/basis caveat; C=historical evidence or qualitative synthesis; D=unavailable or conditional scenario. These rate evidence quality, not certainty of future outcomes.
Silver Ag · overall evidence C
Short reported reserve inventory; mixed retention. Pressure combines a roughly two-decade static inventory, host dependence and dispersed electronics; recoverable precious-metal stocks materially moderate it. [USGS_Ag]
Annual primary output
26,000 t Ag/year2025 estimate, rounded. Primary output; excludes recycled throughput. [USGS_Ag]
mine production, contained element
Reserves
610,000 t AgReported national classifications vary; rounded world total. See chapter footnotes. [USGS_Ag]
Reserve-life proxy
23.5 yearsStatic R/P inventory ratio, not exhaustion date; no resource conversion, prices, demand or recycling dynamics. [USGS_Ag]
Broader resources
global resources unquantified
Not verified t AgOccurrence known; no reliable comparable numeric world total verified. [USGS_Ag]
2050 demand
No comparable published projection verified.Separate 0.75×, 1× and 2× sensitivities are included in the dataset. For materials without measured current demand, these use primary output as an explicitly labeled primary-equivalent proxy.
Cumulative primary extraction-equivalent, 2026 to start-2126
| Conditional case | 2050 primary output | 100-year cumulative |
|---|---|---|
| conservation | 19,500 t Ag/year | 1.78 million t Ag |
| constant | 26,000 t Ag/year | 2.6 million t Ag |
| expansion | 52,000 t Ag/year | 4.88 million t Ag |
Recovered primary output, not all ore moved; no future secondary flow counted as newly extracted. For Ge only normalized scenario indices are available.
Recycling
Comparable current global EOL rate: not verified. The following metrics retain their own denominators and dates.
secondary supply
6,031 t Ag/year193.9 million troy oz recovered. Conversion: 31.1034768 g per troy oz. [SILVER]
secondary share of mine plus recycling
19.1 percentDerived from same-year mine and recycling flows; excludes inventory changes, not EOL rate. [SILVER]
recycled share of apparent consumption
11 percentOld plus new scrap, 1000 t. Not global. [USGS_Ag]
historical end of life recycling benchmark
>50 percentHistorical benchmark only. Must not label current or compare directly with input shares. [UNEP11]
Dissipative use and retained stocks
Global dissipative share and current retained-stock fraction: not quantified.
Bullion, jewelry and large industrial catalysts preserve concentrated stocks. Fine electrical contacts, PV metallization, brazing and biocidal uses create collection or separation losses; industrial use is not synonymous with irreversible loss. [USGS_Ag]
110 g Ag/personHistorical estimate explicitly described as poorly documented; low confidence. [UNEP10]
Byproduct/coproduct dependency
Much primary silver is a coproduct of lead-zinc, copper and gold mines. Host mine economics constrain response to silver prices. [USGS_Ag]
Substitutability
Copper/aluminum and lower silver loadings can reduce some electrical and PV demand; performance, reliability and manufacturing changes limit substitution. No universal substitute. [USGS_Ag]
Ore-grade trend
No consistent global Ag-grade time series verified. Host ore throughput and recovery matter alongside primary silver-mine grade. [USGS_Ag]
Geographic production and refining concentration
Production: Mexico; 24.2%
Calculated from rounded table values; same caveats as production. Re location is recovery country including imported residues; He US includes Canadian feed; Te/Li denominators omit output. [USGS_Ag]
Refining: Not verified; Not verified%
Do not infer refinery shares from mine shares.
Reserve additions / resource conversion
Host base-metal discoveries and mine expansions add silver inventories. Exploration and classification changes can raise reserves without an equivalent newly discovered mass. [USGS_Ag]
No verified global century-scale addition forecast. Dataset scenario gaps are required conversion, not predicted discoveries.
Visualization and confidence
Y = 50; sensitivity 25–75. Components: {'dispersion_exposure': 2, 'recovery_barrier': 2, 'loss_of_economic_recoverability': 2}. Analyst judgment; no measured loss percentage.
26,000 t element/yearReported contained-element tonnes; primary recovered output. [USGS_Ag]
| Field | Evidence grade |
|---|---|
| annual production | A |
| reserves | A |
| resources | D |
| recycling | C |
| dissipative share | D |
| anthropogenic stock mass | D |
| ore grade trend | C |
| 2050 demand | D |
| century extraction | D |
| reserve conversion | D |
| Y score | C |
| overall | C |
A=direct authoritative quantified estimate; B=bounded/partial estimate or source/basis caveat; C=historical evidence or qualitative synthesis; D=unavailable or conditional scenario. These rate evidence quality, not certainty of future outcomes.
Tin Sn · overall evidence C
Short reported reserve inventory; dispersion and recovery constraint. Recovering small solder and coating masses matters as much as reserve expansion. [USGS_Sn] [ITA]
Annual primary output
290,000 t Sn/year2025 estimate, rounded. Primary output; excludes recycled throughput. [USGS_Sn]
mine production, contained element
Reserves
>6 million t SnReported national classifications vary; rounded world total. See chapter footnotes. [USGS_Sn]
Reserve-life proxy
>20.7 yearsStatic R/P inventory ratio, not exhaustion date; no resource conversion, prices, demand or recycling dynamics. [USGS_Sn]
Broader resources
global resources unquantified
Not verified t SnOccurrence known; no reliable comparable numeric world total verified. [USGS_Sn]
2050 demand
No comparable published projection verified.Separate 0.75×, 1× and 2× sensitivities are included in the dataset. For materials without measured current demand, these use primary output as an explicitly labeled primary-equivalent proxy.
Cumulative primary extraction-equivalent, 2026 to start-2126
| Conditional case | 2050 primary output | 100-year cumulative |
|---|---|---|
| conservation | 217,500 t Sn/year | 19.9 million t Sn |
| constant | 290,000 t Sn/year | 29 million t Sn |
| expansion | 580,000 t Sn/year | 54.4 million t Sn |
Recovered primary output, not all ore moved; no future secondary flow counted as newly extracted. For Ge only normalized scenario indices are available.
Recycling
Comparable current global EOL rate: not verified. The following metrics retain their own denominators and dates.
recycling input rate
33.4 percentSecondary refined and unrefined tin; manufacturing scrap included. Not EOL recycling rate. [ITA]
old scrap share of apparent consumption
22 percent10,000 t old scrap; 17,000 t old plus new. [USGS_Sn]
historical end of life recycling benchmark
>50 percentHistorical benchmark only. Must not label current or compare directly with input shares. [UNEP11]
Dissipative use and retained stocks
Global dissipative share and current retained-stock fraction: not quantified.
Solder joints, tinplate and chemicals distribute small masses through larger products. Bronze and segregated solder scrap can remain recoverable; tin in steel recycling may become an unwanted residual rather than functional tin supply. [USGS_Sn] [ITA]
Solder 52%, chemicals 16%, tinplate 11%: use shares, not measured loss shares. [ITA]
Byproduct/coproduct dependency
Dedicated cassiterite mining is important, with polymetallic coproduct streams. Smelting access and ore provenance constrain supply independently of crustal availability. [USGS_Sn] [ITA]
Substitutability
Tin-free packaging and alternative materials replace selected uses. Lead-free electronic solder has limited drop-in substitution, though designs and joining technologies can change. [USGS_Sn] [ITA]
Ore-grade trend
No defensible global grade trend verified. Mature placers, underground deposits and new mines have different grade and recovery trajectories. [USGS_Sn] [ITA]
Geographic production and refining concentration
Production: China; 24.5%
Calculated from rounded table values; same caveats as production. Re location is recovery country including imported residues; He US includes Canadian feed; Te/Li denominators omit output. [USGS_Sn]
Refining: Not verified; Not verified%
Do not infer refinery shares from mine shares.
Reserve additions / resource conversion
Extensive resources and exploration can replenish reserves, conditional on investment, permitting and metallurgical recovery; not a timed exhaustion trajectory. [USGS_Sn] [ITA]
No verified global century-scale addition forecast. Dataset scenario gaps are required conversion, not predicted discoveries.
Visualization and confidence
Y = 60; sensitivity 35–85. Components: {'dispersion_exposure': 3, 'recovery_barrier': 2, 'loss_of_economic_recoverability': 2}. Analyst judgment; no measured loss percentage.
290,000 t element/yearReported contained-element tonnes; primary recovered output. [USGS_Sn]
| Field | Evidence grade |
|---|---|
| annual production | A |
| reserves | A |
| resources | D |
| recycling | C |
| dissipative share | D |
| anthropogenic stock mass | D |
| ore grade trend | C |
| 2050 demand | D |
| century extraction | D |
| reserve conversion | D |
| Y score | C |
| overall | C |
A=direct authoritative quantified estimate; B=bounded/partial estimate or source/basis caveat; C=historical evidence or qualitative synthesis; D=unavailable or conditional scenario. These rate evidence quality, not certainty of future outcomes.
Antimony Sb · overall evidence C
Short reported reserve inventory; chemical dispersion. High-priority combination of weak chemical-use recovery and concentrated primary supply. [USGS_Sb]
Annual primary output
110,000 t Sb/year2025 estimate, rounded. Primary output; excludes recycled throughput. [USGS_Sb]
mine production, contained element
Reserves
>2 million t SbReported national classifications vary; rounded world total. See chapter footnotes. [USGS_Sb]
Reserve-life proxy
>18.2 yearsStatic R/P inventory ratio, not exhaustion date; no resource conversion, prices, demand or recycling dynamics. [USGS_Sb]
Broader resources
global resources unquantified
Not verified t SbOccurrence known; no reliable comparable numeric world total verified. [USGS_Sb]
2050 demand
No comparable published projection verified.Separate 0.75×, 1× and 2× sensitivities are included in the dataset. For materials without measured current demand, these use primary output as an explicitly labeled primary-equivalent proxy.
Cumulative primary extraction-equivalent, 2026 to start-2126
| Conditional case | 2050 primary output | 100-year cumulative |
|---|---|---|
| conservation | 82,500 t Sb/year | 7.55 million t Sb |
| constant | 110,000 t Sb/year | 11 million t Sb |
| expansion | 220,000 t Sb/year | 20.6 million t Sb |
Recovered primary output, not all ore moved; no future secondary flow counted as newly extracted. For Ge only normalized scenario indices are available.
Recycling
Comparable current global EOL rate: not verified. The following metrics retain their own denominators and dates.
historical end of life recycling benchmark
<5 percentHistorical benchmark only. Must not label current or compare directly with input shares. [UNEP11]
Dissipative use and retained stocks
Global dissipative share and current retained-stock fraction: not quantified.
Lead-acid alloy loops retain some antimony. Flame-retardant additives, pigments and dispersed chemical uses often enter mixed waste or residues; recycling lead does not prove complete functional Sb recovery. [USGS_Sb]
Byproduct/coproduct dependency
Dedicated antimony ores and gold/lead coproducts coexist. Antimonial lead recycling depends on lead-battery collection and alloy demand. [USGS_Sb]
Substitutability
Alternative flame-retardant systems and other alloy formulations substitute in some uses with redesign and performance tradeoffs. [USGS_Sb]
Ore-grade trend
No global grade series verified. Deposits differ widely; recovering antimony from host residues can matter more than a global mean ore grade. [USGS_Sb]
Geographic production and refining concentration
Production: China; 36.4%
Calculated from rounded table values; same caveats as production. Re location is recovery country including imported residues; He US includes Canadian feed; Te/Li denominators omit output. [USGS_Sb]
Refining: Not verified; Not verified%
Do not infer refinery shares from mine shares.
Reserve additions / resource conversion
Restarts, new mines and host-ore recovery may add supply. Economic, environmental and processing conditions determine conversion; no global numeric projection. [USGS_Sb]
No verified global century-scale addition forecast. Dataset scenario gaps are required conversion, not predicted discoveries.
Visualization and confidence
Y = 75; sensitivity 50–100. Components: {'dispersion_exposure': 3, 'recovery_barrier': 3, 'loss_of_economic_recoverability': 3}. Analyst judgment; no measured loss percentage.
110,000 t element/yearReported contained-element tonnes; primary recovered output. [USGS_Sb]
| Field | Evidence grade |
|---|---|
| annual production | A |
| reserves | A |
| resources | D |
| recycling | C |
| dissipative share | D |
| anthropogenic stock mass | D |
| ore grade trend | C |
| 2050 demand | D |
| century extraction | D |
| reserve conversion | D |
| Y score | C |
| overall | C |
A=direct authoritative quantified estimate; B=bounded/partial estimate or source/basis caveat; C=historical evidence or qualitative synthesis; D=unavailable or conditional scenario. These rate evidence quality, not certainty of future outcomes.
Zinc Zn · overall evidence C
Short reported reserve inventory; coating losses and durable stocks. Large structural stocks offer secondary supply after service lives; coating corrosion and weak dust recovery remain losses. [USGS_Zn] [IZA]
Annual primary output
13 million t Zn/year2025 estimate, rounded. Primary output; excludes recycled throughput. [USGS_Zn]
mine production, contained element
Reserves
240 million t ZnReported national classifications vary; rounded world total. See chapter footnotes. [USGS_Zn]
Reserve-life proxy
18.5 yearsStatic R/P inventory ratio, not exhaustion date; no resource conversion, prices, demand or recycling dynamics. [USGS_Zn]
Broader resources
identified resources
1.9 billion t ZnBroader inventory including categories beyond economic reserves; do not add reserves again. [USGS_Zn]
2050 demand
No comparable published projection verified.Separate 0.75×, 1× and 2× sensitivities are included in the dataset. For materials without measured current demand, these use primary output as an explicitly labeled primary-equivalent proxy.
Cumulative primary extraction-equivalent, 2026 to start-2126
| Conditional case | 2050 primary output | 100-year cumulative |
|---|---|---|
| conservation | 9.75 million t Zn/year | 892 million t Zn |
| constant | 13 million t Zn/year | 1.3 billion t Zn |
| expansion | 26 million t Zn/year | 2.44 billion t Zn |
Recovered primary output, not all ore moved; no future secondary flow counted as newly extracted. For Ge only normalized scenario indices are available.
Recycling
Comparable current global EOL rate: not verified. The following metrics retain their own denominators and dates.
historical end of life recycling benchmark
>50 percentHistorical benchmark only. Must not label current or compare directly with input shares. [UNEP11]
Dissipative use and retained stocks
Global dissipative share and current retained-stock fraction: not quantified.
Buildings, galvanized steel and brass accumulate substantial stocks. Corrosion intentionally consumes coatings; rubber and fertilizer uses disperse zinc. EAF dust can concentrate zinc for recovery when collection and treatment exist. [USGS_Zn] [IZA]
Byproduct/coproduct dependency
Primary zinc ores commonly carry lead, silver, indium or germanium. Their availability depends on Zn throughput, smelter routing and whether trace metals are actually recovered. [USGS_Zn] [IZA]
Substitutability
Alternative coatings, stainless steel, aluminum and engineering redesign can reduce some uses. Zinc has essential biological functions with no elemental substitute. [USGS_Zn] [IZA]
Ore-grade trend
No global harmonized grade time series verified; mine depletion and new ore bodies vary. Reprocessing dust and residues changes the effective feed mix. [USGS_Zn] [IZA]
Geographic production and refining concentration
Production: China; 31.5%
Calculated from rounded table values; same caveats as production. Re location is recovery country including imported residues; He US includes Canadian feed; Te/Li denominators omit output. [USGS_Zn]
Refining: Not verified; Not verified%
Do not infer refinery shares from mine shares.
Reserve additions / resource conversion
1.9 Gt identified resources exceed reported reserves but need economically justified conversion. Mine capacity and smelter access, not reserve tonnage alone, determine output. [USGS_Zn] [IZA]
No verified global century-scale addition forecast. Dataset scenario gaps are required conversion, not predicted discoveries.
Visualization and confidence
Y = 50; sensitivity 25–75. Components: {'dispersion_exposure': 2, 'recovery_barrier': 2, 'loss_of_economic_recoverability': 2}. Analyst judgment; no measured loss percentage.
13 million t element/yearReported contained-element tonnes; primary recovered output. [USGS_Zn]
| Field | Evidence grade |
|---|---|
| annual production | A |
| reserves | A |
| resources | B |
| recycling | C |
| dissipative share | D |
| anthropogenic stock mass | D |
| ore grade trend | C |
| 2050 demand | D |
| century extraction | D |
| reserve conversion | D |
| Y score | C |
| overall | C |
A=direct authoritative quantified estimate; B=bounded/partial estimate or source/basis caveat; C=historical evidence or qualitative synthesis; D=unavailable or conditional scenario. These rate evidence quality, not certainty of future outcomes.
Tellurium Te · overall evidence C
Byproduct recovery bottleneck; reserve inventory unquantified. Potentially important PV stock, but collection timing and copper-refinery systems govern secondary and primary availability. [USGS_Te]
Annual primary output
1,000 t Te/yearExcludes US withheld output and other unquantified countries; includes Sweden concentrate. Reported subtotal, not complete refined supply. [USGS_Te]
reported refinery output
Reserves
Not verified t TeCommodity chapter explicitly says reserves/resources cannot reliably be quantified; reject ArcGIS legacy reserve figures. [USGS_Te]
Reserve-life proxy
Not verified yearsCommodity chapter explicitly says reserves/resources cannot reliably be quantified; reject ArcGIS legacy reserve figures. [USGS_Te]
Broader resources
global resources unquantified
Not verified t TeOccurrence known; no reliable comparable numeric world total verified. [USGS_Te]
2050 demand
No comparable published projection verified.Separate 0.75×, 1× and 2× sensitivities are included in the dataset. For materials without measured current demand, these use primary output as an explicitly labeled primary-equivalent proxy.
Cumulative primary extraction-equivalent, 2026 to start-2126
| Conditional case | 2050 primary output | 100-year cumulative |
|---|---|---|
| conservation | 750 t Te/year | 68,644 t Te |
| constant | 1,000 t Te/year | 100,000 t Te |
| expansion | 2,000 t Te/year | 187,500 t Te |
Recovered primary output, not all ore moved; no future secondary flow counted as newly extracted. For Ge only normalized scenario indices are available.
Recycling
Comparable current global EOL rate: not verified. The following metrics retain their own denominators and dates.
historical end of life recycling benchmark
<1 percentHistorical benchmark only. Must not label current or compare directly with input shares. [UNEP11]
Dissipative use and retained stocks
Global dissipative share and current retained-stock fraction: not quantified.
CdTe photovoltaic modules retain tellurium for decades if collected. Thermoelectrics and alloys retain material but at low concentrations; uncollected modules and mixed smelter residues can lose it from the functional cycle. [USGS_Te]
Byproduct/coproduct dependency
More than 90% historically comes from electrolytic-copper anode slimes. Copper made by routes without recoverable anode slimes does not automatically yield tellurium. [USGS_Te]
Substitutability
Other PV technologies can replace CdTe at the system level; alternative thermoelectrics and alloy additions have performance tradeoffs. [USGS_Te]
Ore-grade trend
Host Cu mineralogy, Te deportment and anode-slime recovery are key. No global Te ore-grade trend verified; Cu grade alone is insufficient. [USGS_Te]
Geographic production and refining concentration
Production: China; 80%
Calculated from rounded table values; same caveats as production. Re location is recovery country including imported residues; He US includes Canadian feed; Te/Li denominators omit output. [USGS_Te]
Refining: China; 80%
Calculated from rounded table values; same caveats as production. Re location is recovery country including imported residues; He US includes Canadian feed; Te/Li denominators omit output. This is the same reported processing stage, not a second independent observation. [USGS_Te]
Reserve additions / resource conversion
Additional recovery circuits and better recovery from existing slimes may expand supply without equivalent new host mining. Legacy inferred Te reserve figures are rejected. [USGS_Te]
No verified global century-scale addition forecast. Dataset scenario gaps are required conversion, not predicted discoveries.
Visualization and confidence
Y = 58.8; sensitivity 33.8–83.8. Components: {'dispersion_exposure': 2, 'recovery_barrier': 3, 'loss_of_economic_recoverability': 2}. Analyst judgment; no measured loss percentage.
1,000 t element/yearReported contained-element tonnes; primary recovered output. [USGS_Te]
| Field | Evidence grade |
|---|---|
| annual production | B |
| reserves | D |
| resources | D |
| recycling | C |
| dissipative share | D |
| anthropogenic stock mass | D |
| ore grade trend | C |
| 2050 demand | D |
| century extraction | D |
| reserve conversion | D |
| Y score | C |
| overall | C |
A=direct authoritative quantified estimate; B=bounded/partial estimate or source/basis caveat; C=historical evidence or qualitative synthesis; D=unavailable or conditional scenario. These rate evidence quality, not certainty of future outcomes.
Indium In · overall evidence C
Byproduct dependency; diffuse product stocks. Thin-film collection and host-system recovery are stronger warning signals than an unsupported run-out ratio. [USGS_In]
Annual primary output
1,100 t In/yearUSGS estimates use trade, capacity and host-smelter information; uncertainty higher than ordinary mine-output statistics. [USGS_In]
refinery output
Reserves
Not verified t InTable reports annual refinery capacity, not reserves. [USGS_In]
Reserve-life proxy
Not verified yearsTable reports annual refinery capacity, not reserves. [USGS_In]
Broader resources
global resources unquantified
Not verified t InOccurrence known; no reliable comparable numeric world total verified. [USGS_In]
2050 demand
No comparable published projection verified.Separate 0.75×, 1× and 2× sensitivities are included in the dataset. For materials without measured current demand, these use primary output as an explicitly labeled primary-equivalent proxy.
Cumulative primary extraction-equivalent, 2026 to start-2126
| Conditional case | 2050 primary output | 100-year cumulative |
|---|---|---|
| conservation | 825 t In/year | 75,508 t In |
| constant | 1,100 t In/year | 110,000 t In |
| expansion | 2,200 t In/year | 206,250 t In |
Recovered primary output, not all ore moved; no future secondary flow counted as newly extracted. For Ge only normalized scenario indices are available.
Recycling
Comparable current global EOL rate: not verified. The following metrics retain their own denominators and dates.
historical end of life recycling benchmark
<1 percentHistorical benchmark only. Must not label current or compare directly with input shares. [UNEP11]
Dissipative use and retained stocks
Global dissipative share and current retained-stock fraction: not quantified.
ITO thin films and semiconductor devices retain indium physically but at low loading in mixed products. Spent sputtering targets are concentrated manufacturing scrap; their recycling does not establish good end-of-life display recovery. [USGS_In]
Byproduct/coproduct dependency
Most recovery is from sphalerite zinc processing; indium-bearing deposits may not be routed to a capable recovery refinery. [USGS_In]
Substitutability
Conductive oxides, polymers, carbon materials and metal nanowires can replace some ITO applications; optical and electrical specifications restrict substitutes. [USGS_In]
Ore-grade trend
Recoverable Zn deposits contain less than 1 to 100 ppm In. No global trend verified; trace deportment and refinery recovery dominate supply responsiveness. [USGS_In]
Geographic production and refining concentration
Production: China; 69.1%
Calculated from rounded table values; same caveats as production. Re location is recovery country including imported residues; He US includes Canadian feed; Te/Li denominators omit output. [USGS_In]
Refining: China; 69.1%
Calculated from rounded table values; same caveats as production. Re location is recovery country including imported residues; He US includes Canadian feed; Te/Li denominators omit output. This is the same reported processing stage, not a second independent observation. [USGS_In]
Reserve additions / resource conversion
Improved zinc-residue processing, recovery investments and production-scrap loops can expand output. Refinery capacity is not geological reserves. [USGS_In]
No verified global century-scale addition forecast. Dataset scenario gaps are required conversion, not predicted discoveries.
Visualization and confidence
Y = 77.5; sensitivity 52.5–93.8. Components: {'dispersion_exposure': 3, 'recovery_barrier': 4, 'loss_of_economic_recoverability': 2}. Analyst judgment; no measured loss percentage.
1,100 t element/yearReported contained-element tonnes; primary recovered output. [USGS_In]
| Field | Evidence grade |
|---|---|
| annual production | B |
| reserves | D |
| resources | D |
| recycling | C |
| dissipative share | D |
| anthropogenic stock mass | D |
| ore grade trend | C |
| 2050 demand | D |
| century extraction | D |
| reserve conversion | D |
| Y score | C |
| overall | C |
A=direct authoritative quantified estimate; B=bounded/partial estimate or source/basis caveat; C=historical evidence or qualitative synthesis; D=unavailable or conditional scenario. These rate evidence quality, not certainty of future outcomes.
Germanium Ge · overall evidence C
Byproduct bottleneck with major data opacity. High uncertainty itself is material. No mass bubble or reserve-life point is fabricated. [USGS_Ge]
Annual primary output
Not verified t Ge/yearUSGS says global refinery production estimates cannot be reliably verified. Missing is not zero. [USGS_Ge]
refinery output
Reserves
Not verified t GeNo verifiable global reserve total. [USGS_Ge]
Reserve-life proxy
Not verified yearsNo verifiable global reserve total. [USGS_Ge]
Broader resources
global resources unquantified
Not verified t GeOccurrence known; no reliable comparable numeric world total verified. [USGS_Ge]
2050 demand
No comparable published projection verified.Separate 0.75×, 1× and 2× sensitivities are included in the dataset. For materials without measured current demand, these use primary output as an explicitly labeled primary-equivalent proxy.
Cumulative primary extraction-equivalent, 2026 to start-2126
| Conditional case | 2050 primary output | 100-year cumulative |
|---|---|---|
| conservation | Not verified t Ge/year | Not verified t Ge |
| constant | Not verified t Ge/year | Not verified t Ge |
| expansion | Not verified t Ge/year | Not verified t Ge |
Recovered primary output, not all ore moved; no future secondary flow counted as newly extracted. For Ge only normalized scenario indices are available.
Recycling
Comparable current global EOL rate: not verified. The following metrics retain their own denominators and dates.
historical end of life recycling benchmark
<1 percentHistorical benchmark only. Must not label current or compare directly with input shares. [UNEP11]
Dissipative use and retained stocks
Global dissipative share and current retained-stock fraction: not quantified.
Large infrared lenses can be recovered and reprocessed. Fiber-optic doping, semiconductor devices and catalysts put small masses into dispersed systems; factory scrap loops differ from recovery of retired products. [USGS_Ge]
Byproduct/coproduct dependency
Germanium is recovered from selected zinc/lead-zinc-copper ores and lignite-related streams. Most host material does not necessarily enter a Ge-recovery circuit. [USGS_Ge]
Substitutability
Silicon, GaAs and chalcogenide glass substitute in selected electronics/IR uses. Optical windows and performance specifications constrain replacement. [USGS_Ge]
Ore-grade trend
No reliable global production or grade series verified. Mineralogy, host concentrate routing and residue chemistry dominate recoverability. [USGS_Ge]
Geographic production and refining concentration
Production: China; Not verified%
Leading producer, no reliable global denominator. [USGS_Ge]
Refining: China; Not verified%
Leading producer, no reliable global denominator. This is the same reported processing stage, not a second independent observation. [USGS_Ge]
Reserve additions / resource conversion
Tailings and host-processing recovery projects could improve supply; unreported inventories and output preclude numeric reserve-conversion forecasts. [USGS_Ge]
No verified global century-scale addition forecast. Dataset scenario gaps are required conversion, not predicted discoveries.
Visualization and confidence
Y = 68.8; sensitivity 43.8–93.8. Components: {'dispersion_exposure': 3, 'recovery_barrier': 3, 'loss_of_economic_recoverability': 2}. Analyst judgment; no measured loss percentage.
Not verified t element/yearReported contained-element tonnes; primary recovered output. [USGS_Ge]
| Field | Evidence grade |
|---|---|
| annual production | D |
| reserves | D |
| resources | D |
| recycling | C |
| dissipative share | D |
| anthropogenic stock mass | D |
| ore grade trend | C |
| 2050 demand | D |
| century extraction | D |
| reserve conversion | D |
| Y score | C |
| overall | C |
A=direct authoritative quantified estimate; B=bounded/partial estimate or source/basis caveat; C=historical evidence or qualitative synthesis; D=unavailable or conditional scenario. These rate evidence quality, not certainty of future outcomes.
Gallium Ga · overall evidence C
Refining concentration and weak product recycling. Primary low-purity production is overwhelmingly Chinese; large geological occurrence does not remove refinery dependence. [USGS_Ga]
Annual primary output
900 t Ga/year2025 estimate, rounded. Primary output; excludes recycled throughput. [USGS_Ga]
primary low-purity output
Reserves
Not verified t GaContained Ga in bauxite is a resource occurrence estimate, not a recoverable reserve. [USGS_Ga]
Reserve-life proxy
Not verified yearsContained Ga in bauxite is a resource occurrence estimate, not a recoverable reserve. [USGS_Ga]
Broader resources
contained in bauxite resources
>1 million t GaTrace content, not recoverable product. >1 Mt threshold. [USGS_Ga]
2050 demand
No comparable published projection verified.Separate 0.75×, 1× and 2× sensitivities are included in the dataset. For materials without measured current demand, these use primary output as an explicitly labeled primary-equivalent proxy.
Cumulative primary extraction-equivalent, 2026 to start-2126
| Conditional case | 2050 primary output | 100-year cumulative |
|---|---|---|
| conservation | 675 t Ga/year | 61,779 t Ga |
| constant | 900 t Ga/year | 90,000 t Ga |
| expansion | 1,800 t Ga/year | 168,750 t Ga |
Recovered primary output, not all ore moved; no future secondary flow counted as newly extracted. For Ge only normalized scenario indices are available.
Recycling
Comparable current global EOL rate: not verified. The following metrics retain their own denominators and dates.
historical end of life recycling benchmark
<1 percentHistorical benchmark only. Must not label current or compare directly with input shares. [UNEP11]
Dissipative use and retained stocks
Global dissipative share and current retained-stock fraction: not quantified.
GaAs/GaN wafer scrap is recoverable in concentrated manufacturing streams. End-use chips and LEDs contain very small Ga quantities; ordinary electronic-waste collection is not proof of functional Ga recycling. [USGS_Ga]
Byproduct/coproduct dependency
Predominantly an alumina/bauxite-processing byproduct, with some zinc residues. Recovery installations and purification capacity constrain output more directly than bauxite scarcity. [USGS_Ga]
Substitutability
Silicon and SiGe replace selected GaAs uses; GaN/GaAs retain performance advantages in demanding radiofrequency and power applications. [USGS_Ga]
Ore-grade trend
Bauxite averages about 50 ppm Ga per USGS. No global temporal trend verified; Bayer-liquor recovery and high-purity conversion are controlling steps. [USGS_Ga]
Geographic production and refining concentration
Production: China; 99%
Narrative 99%; rounding table China and world both 900 t must not become exactly 100%. [USGS_Ga]
Refining: China; 99%
Narrative 99%; rounding table China and world both 900 t must not become exactly 100%. This is the same reported processing stage, not a second independent observation. [USGS_Ga]
Reserve additions / resource conversion
Installing recovery at alumina plants can convert host-contained potential into supply. >1 Mt contained Ga is not a recoverable reserve or an immediately available feedstock. [USGS_Ga]
No verified global century-scale addition forecast. Dataset scenario gaps are required conversion, not predicted discoveries.
Visualization and confidence
Y = 77.5; sensitivity 52.5–93.8. Components: {'dispersion_exposure': 3, 'recovery_barrier': 4, 'loss_of_economic_recoverability': 2}. Analyst judgment; no measured loss percentage.
900 t element/yearReported contained-element tonnes; primary recovered output. [USGS_Ga]
| Field | Evidence grade |
|---|---|
| annual production | B |
| reserves | D |
| resources | B |
| recycling | C |
| dissipative share | D |
| anthropogenic stock mass | D |
| ore grade trend | C |
| 2050 demand | D |
| century extraction | D |
| reserve conversion | D |
| Y score | C |
| overall | C |
A=direct authoritative quantified estimate; B=bounded/partial estimate or source/basis caveat; C=historical evidence or qualitative synthesis; D=unavailable or conditional scenario. These rate evidence quality, not certainty of future outcomes.
Rhenium Re · overall evidence C
Host-processing constraint with strong specialist recycling. Very small tonnage and high value support targeted loops; supply remains coupled to host production. [USGS_Re]
Annual primary output
81 t Re/yearEstimated recovered Re associated with Cu/Mo production; excludes secondary. Not total Re contained in excavated host ore. [USGS_Re]
recovered byproduct mine output
Reserves
Not verified t ReUSGS world reserve entry is Large, not a numeric global total. Country subtotal is separate. [USGS_Re]
Reserve-life proxy
Not verified yearsUSGS world reserve entry is Large, not a numeric global total. Country subtotal is separate. [USGS_Re]
Broader resources
identified resources, US only
7,000 t ReNot a global resource total. [USGS_Re]
2050 demand
No comparable published projection verified.Separate 0.75×, 1× and 2× sensitivities are included in the dataset. For materials without measured current demand, these use primary output as an explicitly labeled primary-equivalent proxy.
Cumulative primary extraction-equivalent, 2026 to start-2126
| Conditional case | 2050 primary output | 100-year cumulative |
|---|---|---|
| conservation | 60.8 t Re/year | 5,560 t Re |
| constant | 81 t Re/year | 8,100 t Re |
| expansion | 162 t Re/year | 15,188 t Re |
Recovered primary output, not all ore moved; no future secondary flow counted as newly extracted. For Ge only normalized scenario indices are available.
Recycling
Comparable current global EOL rate: not verified. The following metrics retain their own denominators and dates.
secondary supply lower
20 t Re/yearRange 20–25 t; excludes closed-loop catalyst recycling. [USGS_Re]
secondary supply upper
25 t Re/yearRange 20–25 t; excludes closed-loop catalyst recycling. [USGS_Re]
secondary share lower
19.8 percentDerived 20/(81+20), excludes closed-loop catalyst recovery. [USGS_Re]
secondary share upper
23.6 percentDerived 25/(81+25), excludes closed-loop catalyst recovery. [USGS_Re]
historical end of life recycling benchmark
>50 percentHistorical benchmark only. Must not label current or compare directly with input shares. [UNEP11]
Dissipative use and retained stocks
Global dissipative share and current retained-stock fraction: not quantified.
Engine superalloys and Pt-Re catalysts can retain recoverable concentrated rhenium. Closed catalyst loops and segregated engine scrap are valuable; oxidation, unsegregated alloys and unrecovered processing residues cause losses. [USGS_Re]
Byproduct/coproduct dependency
Closely coupled to molybdenum in porphyry copper ores and selected copper ores; capture of roasting/smelter residues is essential. Host output cannot be treated as independently adjustable Re supply. [USGS_Re]
Substitutability
Lower-Re/reduced-Re superalloys and alternative catalyst systems can reduce use; demanding turbine conditions limit direct substitution. [USGS_Re]
Ore-grade trend
No global rhenium-grade series verified. Host deposit mineralogy, Mo concentrate routing and flue/residue capture determine recovered output. [USGS_Re]
Geographic production and refining concentration
Production: Chile; 37%
Calculated from rounded table values; same caveats as production. Re location is recovery country including imported residues; He US includes Canadian feed; Te/Li denominators omit output. [USGS_Re]
Refining: Not verified; Not verified%
Do not infer refinery shares from mine shares.
Reserve additions / resource conversion
Expand residue capture and recycling; country reserves are incomplete and global reserves are described only as Large. Do not divide a partial country total as if global. [USGS_Re]
No verified global century-scale addition forecast. Dataset scenario gaps are required conversion, not predicted discoveries.
Visualization and confidence
Y = 25; sensitivity 0–50. Components: {'dispersion_exposure': 1, 'recovery_barrier': 1, 'loss_of_economic_recoverability': 1}. Analyst judgment; no measured loss percentage.
81 t element/yearReported contained-element tonnes; primary recovered output. [USGS_Re]
| Field | Evidence grade |
|---|---|
| annual production | B |
| reserves | D |
| resources | B |
| recycling | C |
| dissipative share | D |
| anthropogenic stock mass | D |
| ore grade trend | C |
| 2050 demand | D |
| century extraction | D |
| reserve conversion | D |
| Y score | C |
| overall | C |
A=direct authoritative quantified estimate; B=bounded/partial estimate or source/basis caveat; C=historical evidence or qualitative synthesis; D=unavailable or conditional scenario. These rate evidence quality, not certainty of future outcomes.
Tungsten W · overall evidence C
Mining/refining concentration; recoverable engineering stock. Better collection moderates geological pressure, but wear losses and processing concentration remain. [USGS_W]
Annual primary output
85,000 t W/year2025 estimate, rounded. Primary output; excludes recycled throughput. [USGS_W]
mine production, contained element
Reserves
>4.7 million t WReported national classifications vary; rounded world total. See chapter footnotes. [USGS_W]
Reserve-life proxy
>55.3 yearsStatic R/P inventory ratio, not exhaustion date; no resource conversion, prices, demand or recycling dynamics. [USGS_W]
Broader resources
global resources unquantified
Not verified t WOccurrence known; no reliable comparable numeric world total verified. [USGS_W]
2050 demand
No comparable published projection verified.Separate 0.75×, 1× and 2× sensitivities are included in the dataset. For materials without measured current demand, these use primary output as an explicitly labeled primary-equivalent proxy.
Cumulative primary extraction-equivalent, 2026 to start-2126
| Conditional case | 2050 primary output | 100-year cumulative |
|---|---|---|
| conservation | 63,750 t W/year | 5.83 million t W |
| constant | 85,000 t W/year | 8.5 million t W |
| expansion | 170,000 t W/year | 15.9 million t W |
Recovered primary output, not all ore moved; no future secondary flow counted as newly extracted. For Ge only normalized scenario indices are available.
Recycling
Comparable current global EOL rate: not verified. The following metrics retain their own denominators and dates.
historical end of life recycling benchmark
range10–25 percentHistorical benchmark only. Must not label current or compare directly with input shares. [UNEP11]
Dissipative use and retained stocks
Global dissipative share and current retained-stock fraction: not quantified.
Carbide tools, heavy alloys and industrial parts preserve concentrated tungsten. Tool wear and small dispersed components are genuine losses; segregated hardmetal scrap permits direct or chemical recycling. [USGS_W]
Byproduct/coproduct dependency
Dedicated scheelite/wolframite mining with coproducts; chemical conversion and carbide manufacturing concentrate downstream capabilities. [USGS_W]
Substitutability
Ceramics, tool steels and other carbides substitute for some tasks, often with performance losses. Tungsten demand is application-specific. [USGS_W]
Ore-grade trend
No global grade time series verified. Ore mineralogy, beneficiation and recovery govern the feasibility of new deposits. [USGS_W]
Geographic production and refining concentration
Production: China; 78.8%
Calculated from rounded table values; same caveats as production. Re location is recovery country including imported residues; He US includes Canadian feed; Te/Li denominators omit output. [USGS_W]
Refining: Not verified; Not verified%
Do not infer refinery shares from mine shares.
Reserve additions / resource conversion
New mines, restarts and improved beneficiation can convert resources. Reported world reserves are a lower bound and vary in national classification. [USGS_W]
No verified global century-scale addition forecast. Dataset scenario gaps are required conversion, not predicted discoveries.
Visualization and confidence
Y = 35; sensitivity 10–60. Components: {'dispersion_exposure': 2, 'recovery_barrier': 1, 'loss_of_economic_recoverability': 1}. Analyst judgment; no measured loss percentage.
85,000 t element/yearReported contained-element tonnes; primary recovered output. [USGS_W]
| Field | Evidence grade |
|---|---|
| annual production | A |
| reserves | A |
| resources | D |
| recycling | C |
| dissipative share | D |
| anthropogenic stock mass | D |
| ore grade trend | C |
| 2050 demand | D |
| century extraction | D |
| reserve conversion | D |
| Y score | C |
| overall | C |
A=direct authoritative quantified estimate; B=bounded/partial estimate or source/basis caveat; C=historical evidence or qualitative synthesis; D=unavailable or conditional scenario. These rate evidence quality, not certainty of future outcomes.
Phosphorus / phosphate rock P · overall evidence C
Large reserve inventory; essential nutrient dispersion. Priority is loss prevention and nutrient recovery, despite a long static rock R/P ratio. [USGS_P] [OPF6] [OPF7]
Annual primary output
250 million t phosphate rock/year2025 estimate, rounded. Primary output; excludes recycled throughput. [USGS_P]
marketable phosphate-rock mine production
Reserves
73 billion t phosphate rockReported national classifications vary; rounded world total. See chapter footnotes. [USGS_P]
Reserve-life proxy
292 yearsStatic R/P inventory ratio, not exhaustion date; no resource conversion, prices, demand or recycling dynamics. [USGS_P]
Broader resources
geological resources
>300 billion t phosphate rockSome reserve reporting is ore tonnage and grade; resources include offshore occurrences. [USGS_P]
2050 demand
No comparable published projection verified.Separate 0.75×, 1× and 2× sensitivities are included in the dataset. For materials without measured current demand, these use primary output as an explicitly labeled primary-equivalent proxy.
Cumulative primary extraction-equivalent, 2026 to start-2126
| Conditional case | 2050 primary output | 100-year cumulative |
|---|---|---|
| conservation | 188 million t phosphate rock/year | 17.2 billion t phosphate rock |
| constant | 250 million t phosphate rock/year | 25 billion t phosphate rock |
| expansion | 500 million t phosphate rock/year | 46.9 billion t phosphate rock |
Recovered primary output, not all ore moved; no future secondary flow counted as newly extracted. For Ge only normalized scenario indices are available.
Recycling
Comparable current global EOL rate: not verified. The following metrics retain their own denominators and dates.
not recycled share of specific waste stream
85 percentAbout 6 Mt P not recycled; not 85% of all mined P lost. [OPF7]
Dissipative use and retained stocks
Global dissipative share and current retained-stock fraction: not quantified.
Fertilizer moves concentrated rock phosphorus into soils, crops, manure, sewage and waters. Soil legacy P can remain agronomically useful but is not equivalent to recoverable industrial inventory; aquatic dispersal is difficult to reverse. [USGS_P] [OPF6] [OPF7]
85 percentShare of mined phosphorus used as fertilizer. Exposure to diffuse cycle; not measured permanent loss. [OPF6]
Byproduct/coproduct dependency
Phosphate is primarily mined deliberately. Fluorine and potentially uranium recovery are coupled to phosphate beneficiation and phosphoric-acid process choices. [USGS_P] [OPF6] [OPF7]
Substitutability
No substitute for phosphorus in biological nutrition. Better use efficiency, manure reuse and residue recovery reduce primary demand without replacing the element. [USGS_P] [OPF6] [OPF7]
Ore-grade trend
No harmonized global grade trend verified. P2O5 grade, contaminants and beneficiation losses must be tracked by deposit; lower grade increases rock movement per unit nutrient. [USGS_P] [OPF6] [OPF7]
Geographic production and refining concentration
Production: China; 44%
Calculated from rounded table values; same caveats as production. Re location is recovery country including imported residues; He US includes Canadian feed; Te/Li denominators omit output. [USGS_P]
Refining: Not verified; Not verified%
Do not infer refinery shares from mine shares.
Rounded rock tonnage; no inference about annual production control. [USGS_P]
Reserve additions / resource conversion
Large resources do not eliminate regional availability, contaminants, water or processing constraints. Recycling soil/waste P and converting geological resources are different interventions. [USGS_P] [OPF6] [OPF7]
No verified global century-scale addition forecast. Dataset scenario gaps are required conversion, not predicted discoveries.
Visualization and confidence
Y = 85; sensitivity 60–100. Components: {'dispersion_exposure': 4, 'recovery_barrier': 3, 'loss_of_economic_recoverability': 3}. Analyst judgment; no measured loss percentage.
32.7 million t element/yearASSUMED 30% P2O5 in marketable rock, sensitivity 28–32%, converted stoichiometrically to P. Not a measured world-average assay. [USGS_P]
| Field | Evidence grade |
|---|---|
| annual production | A |
| reserves | A |
| resources | B |
| recycling | C |
| dissipative share | D |
| anthropogenic stock mass | D |
| ore grade trend | C |
| 2050 demand | D |
| century extraction | D |
| reserve conversion | D |
| Y score | C |
| overall | C |
A=direct authoritative quantified estimate; B=bounded/partial estimate or source/basis caveat; C=historical evidence or qualitative synthesis; D=unavailable or conditional scenario. These rate evidence quality, not certainty of future outcomes.
Fluorspar / fluorine F · overall evidence C
Chemical dissipation and limited closed recovery. Economic dilution, not destruction of fluorine atoms, is the central loss mechanism. [USGS_F]
Annual primary output
10 million t fluorspar/year2025 estimate, rounded. Primary output; excludes recycled throughput. [USGS_F]
fluorspar mine production
Reserves
330 million t fluorsparReported national classifications vary; rounded world total. See chapter footnotes. [USGS_F]
Reserve-life proxy
33 yearsStatic R/P inventory ratio, not exhaustion date; no resource conversion, prices, demand or recycling dynamics. [USGS_F]
Broader resources
fluorine in phosphate-rock reserves
5 billion t pure CaF2 equivalentPotential host inventory, not fluorspar reserves. Chapter uses 74 Gt phosphate rock, conflicting with 73 Gt in phosphate chapter. Recovery limited by phosphate processing. [USGS_F]
2050 demand
No comparable published projection verified.Separate 0.75×, 1× and 2× sensitivities are included in the dataset. For materials without measured current demand, these use primary output as an explicitly labeled primary-equivalent proxy.
Cumulative primary extraction-equivalent, 2026 to start-2126
| Conditional case | 2050 primary output | 100-year cumulative |
|---|---|---|
| conservation | 7.5 million t fluorspar/year | 686 million t fluorspar |
| constant | 10 million t fluorspar/year | 1 billion t fluorspar |
| expansion | 20 million t fluorspar/year | 1.88 billion t fluorspar |
Recovered primary output, not all ore moved; no future secondary flow counted as newly extracted. For Ge only normalized scenario indices are available.
Recycling
Comparable current global EOL rate: not verified. The following metrics retain their own denominators and dates.
alternative secondary feed equivalent
73,000 t CaF2 equivalent/year45,000 t fluorosilicic acid from phosphate plants; not a global recycling fraction. [USGS_F]
Dissipative use and retained stocks
Global dissipative share and current retained-stock fraction: not quantified.
Fluxes and chemical manufacture send fluorine into slags, gypsum, salts and emissions-control residues. Refrigerants and fluoropolymers retain some stocks, but recapturing elemental F economically depends on chemistry and collection. [USGS_F]
Byproduct/coproduct dependency
Fluorspar mining is primary; fluorosilicic-acid recovery depends on phosphate processing. Aluminum fluoride and HF systems create additional recovery opportunities. [USGS_F]
Substitutability
Alternative fluxes and refrigerant/chemical designs reduce selected needs. Fluorine-dependent properties cannot always be replaced without redesign. [USGS_F]
Ore-grade trend
No global fluorspar-grade trend verified. Acid-grade product requirements, impurities and beneficiation yields govern usable supply. [USGS_F]
Geographic production and refining concentration
Production: China; 60%
Calculated from rounded table values; same caveats as production. Re location is recovery country including imported residues; He US includes Canadian feed; Te/Li denominators omit output. [USGS_F]
Refining: Not verified; Not verified%
Do not infer refinery shares from mine shares.
Reserve additions / resource conversion
New mines/restarts and phosphate-derived fluorine can expand supply. The latter is a host-contained equivalent, not immediately extractable fluorspar reserves. [USGS_F]
No verified global century-scale addition forecast. Dataset scenario gaps are required conversion, not predicted discoveries.
Visualization and confidence
Y = 85; sensitivity 60–100. Components: {'dispersion_exposure': 4, 'recovery_barrier': 3, 'loss_of_economic_recoverability': 3}. Analyst judgment; no measured loss percentage.
4.38 million t element/yearASSUMED 90% CaF2 average, sensitivity 80–97%, converted stoichiometrically to F. Not a measured world-average assay. [USGS_F]
| Field | Evidence grade |
|---|---|
| annual production | A |
| reserves | A |
| resources | B |
| recycling | C |
| dissipative share | D |
| anthropogenic stock mass | D |
| ore grade trend | C |
| 2050 demand | D |
| century extraction | D |
| reserve conversion | D |
| Y score | C |
| overall | C |
A=direct authoritative quantified estimate; B=bounded/partial estimate or source/basis caveat; C=historical evidence or qualitative synthesis; D=unavailable or conditional scenario. These rate evidence quality, not certainty of future outcomes.
Copper Cu · overall evidence C
High extraction intensity and demand growth; strong stock retention. Century-scale tonnage and development pace dominate; urban stocks are valuable but become scrap only after product retirement. [USGS_Cu] [BHP26] [IEA25]
Annual primary output
23 million t Cu/year2025 estimate, rounded. Primary output; excludes recycled throughput. [USGS_Cu]
mine production, contained element
Reserves
980 million t CuReported national classifications vary; rounded world total. See chapter footnotes. [USGS_Cu]
Reserve-life proxy
42.6 yearsStatic R/P inventory ratio, not exhaustion date; no resource conversion, prices, demand or recycling dynamics. [USGS_Cu]
Broader resources
identified unextracted resources
1.5 billion t CuDo not include 600 Mt past extraction in remaining inventory. [USGS_Cu]
estimated undiscovered resources
3.5 billion t CuProbabilistic geological assessment; neither discovered deposits nor economic reserves. [USGS_Cu]
2050 demand
>50 million t Cu/yearBHP outlook says >50 Mt global demand. Not mine production; producer interest noted. [BHP26]
37 million t refined Cu/yearIEA STEPS, p.108; excludes direct-use scrap. Not directly comparable with BHP >50 Mt broader-demand outlook. Do not present 37–50 as a statistical range. [IEAPDF]
Separate 0.75×, 1× and 2× sensitivities are included in the dataset. For materials without measured current demand, these use primary output as an explicitly labeled primary-equivalent proxy.
Cumulative primary extraction-equivalent, 2026 to start-2126
| Conditional case | 2050 primary output | 100-year cumulative |
|---|---|---|
| conservation | 17.2 million t Cu/year | 1.58 billion t Cu |
| constant | 23 million t Cu/year | 2.3 billion t Cu |
| expansion | 46 million t Cu/year | 4.31 billion t Cu |
Recovered primary output, not all ore moved; no future secondary flow counted as newly extracted. For Ge only normalized scenario indices are available.
Recycling
Comparable current global EOL rate: not verified. The following metrics retain their own denominators and dates.
scrap share of supply
30 percent160,000 t old plus 760,000 t new scrap; approximate, not global EOL rate. [USGS_Cu]
historical end of life recycling benchmark
>50 percentHistorical benchmark only. Must not label current or compare directly with input shares. [UNEP11]
Dissipative use and retained stocks
Global dissipative share and current retained-stock fraction: not quantified.
Wires, buildings, motors and grid equipment form large anthropogenic stocks. Collection, sorting and refining can preserve copper function; alloys, tiny electronics and uncollected waste create losses and downcycling. [USGS_Cu] [BHP26] [IEA25]
35–55 kg Cu/personHistorical in-use stock range. Do not multiply by current population to invent a current global stock. [UNEP10]
35 percent reduction in need for new mine developmentIEA STEPS p.100 recycling comparison. Not recycled content, EOL recycling rate or guaranteed reduction in all mine output. [IEAPDF]
Byproduct/coproduct dependency
Large dedicated Cu mining sector, often with valuable coproducts including Mo, Ag, Re and Te; process-route changes alter byproduct recoverability. [USGS_Cu] [BHP26] [IEA25]
Substitutability
Aluminum replaces copper in some conductors with changes in size and joining; fiber replaces signal transmission, not power delivery. Performance limits remain. [USGS_Cu] [BHP26] [IEA25]
Ore-grade trend
Declining grades in mature mines and increasing complexity are cited by BHP; no single defensible world decline percentage is assigned. Reserve tonnage growth can coexist with higher energy/water use. [USGS_Cu] [BHP26] [IEA25]
Geographic production and refining concentration
Production: Chile; 23%
Calculated from rounded table values; same caveats as production. Re location is recovery country including imported residues; He US includes Canadian feed; Te/Li denominators omit output. [USGS_Cu]
Refining: China; 48.3%
14 Mt out of 29 Mt; refining and mining denominators differ. [USGS_Cu]
Reserve additions / resource conversion
Geological resources are much larger than reserves, but long lead times, costs and infrastructure constrain conversion. Secondary supply can reduce mine requirements without equivalent newly mined reserve additions. [USGS_Cu] [BHP26] [IEA25]
No verified global century-scale addition forecast. Dataset scenario gaps are required conversion, not predicted discoveries.
Visualization and confidence
Y = 25; sensitivity 0–50. Components: {'dispersion_exposure': 1, 'recovery_barrier': 1, 'loss_of_economic_recoverability': 1}. Analyst judgment; no measured loss percentage.
23 million t element/yearReported contained-element tonnes; primary recovered output. [USGS_Cu]
| Field | Evidence grade |
|---|---|
| annual production | A |
| reserves | A |
| resources | B |
| recycling | C |
| dissipative share | D |
| anthropogenic stock mass | D |
| ore grade trend | C |
| 2050 demand | B |
| century extraction | D |
| reserve conversion | D |
| Y score | C |
| overall | C |
A=direct authoritative quantified estimate; B=bounded/partial estimate or source/basis caveat; C=historical evidence or qualitative synthesis; D=unavailable or conditional scenario. These rate evidence quality, not certainty of future outcomes.
Lithium Li · overall evidence C
Rapid-demand and processing pressure; growing recoverable stock. Long current R/P is compatible with near-term bottlenecks under fast demand growth. Future battery recycling should not be counted before scrap exists. [USGS_Li]
Annual primary output
290,000 t Li/yearExcludes withheld US mine output. Reserve numerator includes US: R/P is an upward-biased approximation. [USGS_Li]
mine production, contained element
Reserves
37 million t LiReported national classifications vary; rounded world total. See chapter footnotes. [USGS_Li]
Reserve-life proxy
128 yearsStatic R/P inventory ratio, not exhaustion date; no resource conversion, prices, demand or recycling dynamics. Denominator excludes withheld US output, numerator includes US; biased upward. [USGS_Li]
Broader resources
measured and indicated resources
150 million t LiUSGS global compilation; heterogeneous national estimates, includes 30 Mt US. Not all recoverable. [USGS_Li]
2050 demand
1.16 million t Li/yearIEA STEPS, p.120. APS about 30% higher; NZE a further 20% higher. Elemental lithium, not LCE. [IEAPDF]
Separate 0.75×, 1× and 2× sensitivities are included in the dataset. For materials without measured current demand, these use primary output as an explicitly labeled primary-equivalent proxy.
Cumulative primary extraction-equivalent, 2026 to start-2126
| Conditional case | 2050 primary output | 100-year cumulative |
|---|---|---|
| conservation | 217,500 t Li/year | 19.9 million t Li |
| constant | 290,000 t Li/year | 29 million t Li |
| expansion | 580,000 t Li/year | 54.4 million t Li |
Recovered primary output, not all ore moved; no future secondary flow counted as newly extracted. For Ge only normalized scenario indices are available.
Recycling
Comparable current global EOL rate: not verified. The following metrics retain their own denominators and dates.
historical end of life recycling benchmark
<1 percentHistorical benchmark only. Must not label current or compare directly with input shares. [UNEP11]
Dissipative use and retained stocks
Global dissipative share and current retained-stock fraction: not quantified.
Batteries accumulate lithium stocks that can be recovered if collected and processed for Li, not only other cathode metals. Ceramics, glass and lubricants disperse Li; rapid stock growth delays availability of end-of-life scrap. [USGS_Li]
>20 percent reduction in need for new mine developmentIEA STEPS p.100 recycling comparison. Not recycled content, EOL recycling rate or guaranteed reduction in all mine output. [IEAPDF]
Byproduct/coproduct dependency
Deliberate brine and hard-rock extraction; chemical conversion to battery grade is a separate bottleneck. Lithium is not principally a byproduct constraint. [USGS_Li]
Substitutability
Alternative battery chemistries and other storage systems reduce selected uses. LFP removes nickel/cobalt, not lithium. System substitution depends on energy density and duty cycle. [USGS_Li]
Ore-grade trend
No unified global grade trend across brines, pegmatites and clays. Concentration, impurities, water use and recovery yield differ; resource tonnage alone is insufficient. [USGS_Li]
Geographic production and refining concentration
Production: Australia; 31.7%
Calculated from rounded table values; same caveats as production. Re location is recovery country including imported residues; He US includes Canadian feed; Te/Li denominators omit output. [USGS_Li]
Refining: Not verified; Not verified%
Do not infer refinery shares from mine shares.
Reserve additions / resource conversion
Resource expansion is large, but direct extraction, clay processing and brine projects require demonstrated recovery and economics. Mine output already differs from demand and inventories. [USGS_Li]
No verified global century-scale addition forecast. Dataset scenario gaps are required conversion, not predicted discoveries.
Visualization and confidence
Y = 50; sensitivity 25–75. Components: {'dispersion_exposure': 2, 'recovery_barrier': 2, 'loss_of_economic_recoverability': 2}. Analyst judgment; no measured loss percentage.
290,000 t element/yearReported contained-element tonnes; primary recovered output. [USGS_Li]
| Field | Evidence grade |
|---|---|
| annual production | A |
| reserves | B |
| resources | B |
| recycling | C |
| dissipative share | D |
| anthropogenic stock mass | D |
| ore grade trend | C |
| 2050 demand | B |
| century extraction | D |
| reserve conversion | D |
| Y score | C |
| overall | C |
A=direct authoritative quantified estimate; B=bounded/partial estimate or source/basis caveat; C=historical evidence or qualitative synthesis; D=unavailable or conditional scenario. These rate evidence quality, not certainty of future outcomes.
Uranium U · overall evidence C
Fuel-cycle constraint; retained stocks plus irreversible fission. Do not label all mined uranium dissipated, and do not treat all spent fuel as readily reusable energy. [NEA26] [WNAFUEL] [WNASTOCK]
Annual primary output
61,924 t U/year2024 actual mine production reported in September 2026 release; annual reactor requirements are a separate flow. [NEA26]
mine production, contained element
Reserves
Not verified t UNEA/IAEA identified recoverable resources by cost category are not USGS-style economic reserves. [NEA26]
Reserve-life proxy
Not verified yearsNEA/IAEA identified recoverable resources by cost category are not USGS-style economic reserves. [NEA26]
Broader resources
identified recoverable resources below USD260/kgU
>8.1 million t ULower threshold from release (>8.1 Mt). Cost-tier inventory; not economic reserves or all crustal uranium. [NEA26]
2050 demand
84,800–143,900 t U/yearLow/high nuclear-capacity growth reactor requirements; not a probabilistic interval or mine extraction. [NEA26]
Separate 0.75×, 1× and 2× sensitivities are included in the dataset. For materials without measured current demand, these use primary output as an explicitly labeled primary-equivalent proxy.
Cumulative primary extraction-equivalent, 2026 to start-2126
| Conditional case | 2050 primary output | 100-year cumulative |
|---|---|---|
| conservation | 46,443 t U/year | 4.25 million t U |
| constant | 61,924 t U/year | 6.19 million t U |
| expansion | 123,848 t U/year | 11.6 million t U |
Recovered primary output, not all ore moved; no future secondary flow counted as newly extracted. For Ge only normalized scenario indices are available.
Recycling
Comparable current global EOL rate: not verified. The following metrics retain their own denominators and dates.
Qualitative pathways are documented below; no globally comparable rate is assigned.
Dissipative use and retained stocks
Global dissipative share and current retained-stock fraction: not quantified.
Fission irreversibly transforms the atoms that fission; most natural uranium feed is retained in enrichment tails or used fuel. Used-fuel uranium and tails are physical stocks with isotope, radiological, policy and processing barriers to reuse. [NEA26] [WNAFUEL] [WNASTOCK]
1.2 million t depleted UEnrichment tails, not in-use finished products; potential future feed, not currently equivalent to natural uranium demand. [WNAFUEL]
147,000 t U equivalentDerived 42,000 + 40,000 + 65,000 t inventories. Not complete global anthropogenic stock or all spent fuel. [WNASTOCK]
96 percent of used-fuel massTypical used fuel is about 96% uranium. Not 96% of original natural-U feed and not a recycling rate; tails are another stock. [WNAFUEL]
Byproduct/coproduct dependency
Dedicated uranium mines dominate with some coproduct recovery. Conversion, enrichment, fuel fabrication and reprocessing are distinct system constraints. [NEA26] [WNAFUEL] [WNASTOCK]
Substitutability
Other energy sources can replace nuclear electricity. Breeding and alternate fuel cycles may greatly extend uranium utilization, but are not assumed deployed at scale in these scenarios. [NEA26] [WNAFUEL] [WNASTOCK]
Ore-grade trend
High-grade deposits, low-grade bulk mines and in-situ recovery are not comparable by one grade. No global temporal trend assigned; isotope utilization and enrichment tails also affect natural-U demand. [NEA26] [WNAFUEL] [WNASTOCK]
Geographic production and refining concentration
Production: Kazakhstan; 39%
WNA published rounded shares use its 60,213 t global total. NEA later reports 61,924 t. Keep WNA shares on their own denominator; do not splice country outputs onto NEA total. [WNAMINE]
Refining: Not verified; Not verified%
Do not infer refinery shares from mine shares.
Reserve additions / resource conversion
Cost-tier resources, exploration and investment can increase supply; NEA notes 15–20-year mine-development lead times. Breeders/reprocessing are scenario choices, not automatic reserve additions. [NEA26] [WNAFUEL] [WNASTOCK]
No verified global century-scale addition forecast. Dataset scenario gaps are required conversion, not predicted discoveries.
Visualization and confidence
Y = 42.5; sensitivity 17.5–67.5. Components: {'dispersion_exposure': 1, 'recovery_barrier': 3, 'loss_of_economic_recoverability': 1}. Analyst judgment; no measured loss percentage.
61,924 t element/yearReported contained-element tonnes; primary recovered output. [NEA26]
| Field | Evidence grade |
|---|---|
| annual production | A |
| reserves | D |
| resources | B |
| recycling | C |
| dissipative share | D |
| anthropogenic stock mass | D |
| ore grade trend | C |
| 2050 demand | B |
| century extraction | D |
| reserve conversion | D |
| Y score | C |
| overall | C |
A=direct authoritative quantified estimate; B=bounded/partial estimate or source/basis caveat; C=historical evidence or qualitative synthesis; D=unavailable or conditional scenario. These rate evidence quality, not certainty of future outcomes.
Methodology and interpretation
Study design, equations, scoring rubric and limitations
Methodology and Interpretation
Study scope and evidence base
This study compares depletion pressure, material dissipation, and the potential retention of recoverable anthropogenic stocks across 16 nonrenewable materials. The evidence base comprises a bounded literature review with a research cutoff of 18 September 2026. It combines reported production and geological inventories with available evidence on recycling, material uses, recovery barriers, and future demand.
The analysis distinguishes reported observations, derived calculations, published projections, and analyst assumptions. Where comparable evidence could not be established, the relevant field remains unquantified. This approach preserves uncertainty rather than filling gaps with estimates drawn from incompatible definitions, reporting periods, or stages of production.
The study is not a complete global material-flow census. Its purpose is to provide a reproducible framework for comparing different mechanisms of resource pressure while making the limits of that comparison explicit.
Geological inventories and production boundaries
Reserves and resources
Reserves are the economically extractable portion of an identified mineral inventory under the technical, economic, and reporting conditions prevailing at the time of assessment. Reserve estimates change with exploration, commodity prices, operating costs, engineering studies, recovery technology, permitting, and classification decisions. They therefore represent a changing economic inventory rather than a fixed measure of the Earth’s remaining physical endowment.
National reporting conventions also differ. Some country estimates incorporate categories broader than reserves reported under company-level codes such as the Joint Ore Reserves Committee framework. Aggregated global totals consequently retain some heterogeneity even when compiled by a single authoritative source.
Resources describe broader geological inventories, including material that may lack demonstrated economic extraction prospects. Identified resources, inferred resources, undiscovered-resource assessments, trace elements contained in host commodities, and uranium resources classified by recovery cost are retained as distinct categories. Because reserves commonly form part of a broader resource estimate, the two quantities are not added together.
Annual production
The production baseline is the latest verified full-year quantity available within the study’s evidence boundary. Most material profiles use the United States Geological Survey’s estimates for 2025. Uranium uses 2024 mine production reported in the September 2026 release from the OECD Nuclear Energy Agency and International Atomic Energy Agency.
Production quantities are recorded with their units, reference years, geographic coverage, and processing stages. These distinctions matter because the reported flows are not uniformly mine output. Gallium is measured as primary low-purity production; indium and tellurium use refinery estimates; and rhenium represents recovered byproduct output. Helium statistics also reflect processing-location effects. Reported tellurium and lithium totals omit some national output, while a comparable global production quantity for germanium could not be verified.
Accordingly, comparisons involving these materials inherit the limitations of the reported production stage and coverage.
Reserve-life calculation and source selection
The reserve-life proxy is calculated as:
where is the reported reserve inventory for material , and is its baseline annual primary production on the same material basis. The resulting quantity, , is expressed in years.
This ratio describes how large the current reported reserve inventory is relative to one year of production. It does not model future demand, reserve additions, recycling, substitution, price responses, or changes in extraction technology. It therefore cannot establish an exhaustion date.
Comparison operators are preserved throughout the calculation. A reserve estimate reported as greater than a specified quantity produces a corresponding lower-bound ratio: more than 20.7 years for tin, more than 18.2 years for antimony, and more than 55.3 years for tungsten. These values indicate thresholds rather than exact positions.
Lithium requires an additional qualification. Its approximately 127.6-year ratio divides global reserves, including United States reserves, by reported output that excludes withheld United States production. The resulting ratio is biased upward relative to a calculation with complete geographic coverage.
Where USGS commodity chapters conflict with associated ArcGIS records, the complete commodity chapters are selected because they preserve global totals, explanatory text, and footnotes needed to interpret the figures. This is a consistency rule rather than an assumption that every chapter entry is necessarily more recent. The evidence archive retains the accessed report, its cryptographic hash, and a register of conflicting values and selection decisions.
Material conflicts affect lithium, copper, phosphate rock, fluorspar, and tellurium. Comparable numerical global reserves are not assigned to helium, tellurium, indium, germanium, gallium, rhenium, or uranium where the available evidence does not support them. Refinery capacity, host-contained material, partial country subtotals, and cost-tier resources are not substituted for economic reserves.
Anthropogenic stocks and material dissipation
The analysis distinguishes five material destinations:
- Functioning products and infrastructure.
- Collected recyclable scrap.
- Landfills and stockpiled residues.
- Dispersed environmental sinks.
- Nuclear transformation.
These categories separate physical retention from practical recoverability. A material may remain physically present while becoming too dilute, contaminated, inaccessible, or costly to recover. A trace element embedded in glass and the same element concentrated in a spent catalyst therefore represent different secondary-supply opportunities.
Material held in functioning products is also distinguished from material available for immediate recycling. The release of in-use stocks depends on product lifetimes and retirement patterns; subsequent recovery depends on collection, sorting, processing yields, and the preservation of material function. Manufacturing scrap circulating within a closed production loop is not treated as repeated additions of primary material or as postconsumer recovery.
The meaning of dissipation varies by material. Venting transfers helium into dilute atmospheric concentrations that are economically difficult to recover. Phosphorus accumulation in soil does not necessarily constitute permanent loss because some legacy soil phosphorus remains agronomically available. The destruction of a fluorinated molecule does not destroy its fluorine atoms, although their subsequent distribution and chemical form may impede recovery. Uranium introduces a different mechanism: atoms undergoing nuclear reactions can change identity, while much of the original natural-uranium feed remains physically retained in enrichment tails or used fuel.
Comparable contemporary global estimates of dissipative-use shares and retained-stock fractions were not consistently available. These fields remain unquantified, with narrower use statistics and historical stock estimates recorded separately. Missing values signify an evidence gap; they imply neither zero loss nor complete retention.
Recycling measures and denominators
Recycling statistics are classified according to the process and denominator they measure.
The end-of-life recycling rate is defined as:
The recycling input rate is:
The secondary-supply share is:
Each ratio applies to a specified material, reporting period, geography, and system boundary. Collection efficiency and plant recovery yield describe additional stages and are not interchangeable with these measures.
The evidence includes institutional helium reuse, global tin recycling input, silver secondary supply, United States scrap shares, global secondary rhenium tonnage, and phosphorus losses within specified waste streams. Their original boundaries are retained. Institutional helium reuse is not interpreted as a global recovery rate, and tin manufacturing scrap is not equated with recovery from retired products.
The UNEP recycling bands published in 2011 are used as historical benchmarks rather than contemporary observations. Uranium reprocessing is considered separately because recovery of material from used fuel is not equivalent to utilization of the full original natural-uranium feed.
Published demand projections and analytical sensitivities
Published 2050 projections are retained with their original scenarios and demand definitions. These include BHP’s broader copper-demand outlook, the International Energy Agency’s Stated Policies Scenario for refined copper and lithium, and NEA/IAEA projections of uranium reactor requirements.
The IEA refined-copper series excludes direct-use scrap and is therefore not directly interchangeable with BHP’s broader copper-demand estimate. Differences between these projections are not treated as a statistical uncertainty range.
Where comparable published projections were not verified, the corresponding fields remain unquantified. Separate analytical sensitivities explore possible 2050 demand levels. Where reported total demand is available—silver, lithium, and uranium—the sensitivities use that baseline. For other materials, they use primary output as a proxy and are identified as primary-equivalent sensitivities rather than forecasts of total market demand. Germanium retains unquantified tonnage because a suitable production baseline was unavailable.
These sensitivities are conditional calculations. They are not calibrated sector models, probability estimates, or confidence bounds.
Century-scale primary-output scenarios
Three standardized scenarios are used to compare the cumulative implications of different primary-output paths. Applying a common set of assumptions makes the calculations reproducible and separates the effect of the starting production baseline from assumptions about future growth.
| Scenario | Output path to 2050 | Output path after 2050 |
|---|---|---|
| Conservation | Linear decline from the baseline to 75% of baseline output | Decline of 0.5% per year |
| Constant | Baseline output maintained | Baseline output maintained |
| Expansion | Linear increase to twice baseline output | Output maintained at twice baseline |
For scenario , the annual output index is:
Here, is the output multiplier reached in 2050 and is the subsequent annual growth rate. The conservation scenario uses and ; the constant scenario uses and ; and the expansion scenario uses and .
Cumulative primary output is calculated as:
where year. The study interval runs from 1 January 2026 to 1 January 2126, comprising 100 annual periods. Calendar year 2126 is not included as an additional production year.
The three paths produce cumulative quantities equivalent to approximately 68.64, 100, and 187.5 years of baseline output, respectively. These quantities represent conditional recovered-primary-output equivalents. They exclude overburden and material remaining unrecovered in ore or tailings. For refinery-based byproducts and helium, they retain the processing-stage limitations of the baseline statistics. Inventory withdrawals and recycled material are not counted as new extraction.
The scenarios are not forecasts of physically realizable supply. They do not model material-specific technological transitions, substitution, prices, project delivery, or feedback between scarcity and demand. A doubling of output by 2050 may understate a rapid lithium transition while overstating requirements for a material undergoing substitution. The scenarios therefore carry no assigned probabilities or claims of relative likelihood.
Implied reserve conversion
An accounting measure of the additional reserve inventory required to support a scenario is calculated as:
This calculation assumes that no reserve inventory remains at the end of the interval. Maintaining an ending reserve cushion would increase the requirement.
The measure identifies the cumulative output not covered by today’s reported reserves. It does not forecast discoveries, demonstrate that resources can be converted economically, or establish when additions would be needed. Where the initial reserve estimate is a lower bound, a positive calculated gap is an upper bound on the corresponding accounting requirement.
No century-scale forecast of global reserve additions is inferred from this calculation.
Relationship to a dynamic stock model
The present scenarios do not incorporate a complete dynamic stock-and-flow model. Such a model would need to reconcile flows on consistent material and process boundaries:
and:
Under that framework, secondary supply would be constrained by the availability of retired products, collection performance, and recovery yields. An end-of-life recycling percentage cannot simply be subtracted from gross demand to obtain primary requirements, particularly during periods of rapid stock growth.
Visualization and screening rubric
Horizontal position
The horizontal axis displays the reserve-life proxy in years on a logarithmic scale. This permits comparison across a wide range of inventory-to-production ratios without allowing the longest values to dominate the figure.
Lower-bound ratios are plotted at their reported thresholds with right-pointing indicators. Materials without a comparable reserve-life calculation appear in a separate panel rather than receiving an artificial zero or a resource-based substitute. Nine of the 16 materials meet the requirements for horizontal placement.
Vertical position
The vertical axis is an analyst-assigned irreversibility and dissipation screening index, calculated as:
The three components are scored from zero to four:
| Score | Dispersion exposure, | Practical recovery barrier, | Loss of economic recoverability, |
|---|---|---|---|
| 0 | Negligible dispersion | Routine, comprehensive recovery loops | Negligible loss |
| 1 | Predominantly bulk, durable products | Mature recovery of valuable scrap | Predominantly segregable retained stocks |
| 2 | Mixed bulk and small-scale uses | Uneven collection or recovery | Mixed retained and inaccessible destinations |
| 3 | Extensive low-loading or coating uses | Substantial economic or process barriers | Dilution or waste sinks that are difficult to reverse |
| 4 | Predominantly open or diffuse use pathways | Weak functional recovery from end uses | Open environmental release with very limited recapture |
The weights assign the greatest emphasis to dispersion exposure, followed by practical recovery barriers and loss of economic recoverability. They are analytical choices rather than empirically fitted coefficients. Multiplication by 25 expresses the weighted score on a 0–100 scale.
The components distinguish where material goes, how difficult it is to recover, and how much economic accessibility is lost. They nevertheless overlap and are not independent physical measurements. Each material’s assignment is accompanied by a qualitative rationale.
The index describes broad recovery conditions. A score of 75 does not mean that 75% of the material is lost, nor does it represent a 75% probability of depletion. Differences between scores are not calibrated physical differences.
Sensitivity envelopes are calculated by increasing or decreasing all three component scores by one point, with each component bounded between zero and four. These envelopes show sensitivity to the scoring judgments; they are not statistical confidence intervals and do not test every possible alternative weighting scheme. Close rankings and overlapping envelopes therefore provide limited evidence of meaningful differences.
Geological scarcity, host-commodity dependence, and geographic concentration are assessed separately rather than added directly to the index. Practical recovery barriers remain partly dependent on industrial conditions, so the index cannot be regarded as entirely independent of the wider material system.
Bubble area and material conversions
Bubble area is proportional to annual tonnes of contained element at the reported primary-output stage:
where is annual contained-element throughput and is a common graphical scaling factor. Proportionality applies to area rather than radius. No logarithmic transformation or minimum bubble area is imposed. Labels and unfilled position markers preserve the visibility of small flows without artificially enlarging their represented throughput.
Bubble size measures mass flow, not economic value, strategic importance, or environmental impact.
Helium volume is converted to mass using the USGS reference-condition relationship:
Phosphate rock and fluorspar require assumptions about mineral-product composition. The central estimates assume 30% phosphorus pentoxide () in phosphate rock and 90% calcium fluoride () in fluorspar, with sensitivity ranges of 28–32% and 80–97%, respectively. Contained-element mass is then derived stoichiometrically:
Here, denotes the assumed compound mass fraction and denotes molar mass. These composition assumptions are not measured global-average assays. Original mineral-product quantities remain the basis for reserve-life calculations and cumulative-output scenarios. No mass bubble is assigned to germanium.
Evidence quality, limitations, and reproducibility
Evidence ratings are assigned to individual fields:
| Rating | Interpretation |
|---|---|
| A | Direct, authoritative quantified estimate |
| B | Partial, bounded, heterogeneous, or scope-limited estimate |
| C | Historical benchmark, qualitative evidence, or analyst synthesis |
| D | Unverified or absent quantity, or conditional scenario |
These categories describe the basis of the evidence rather than depletion risk. A conditional scenario receives a different evidentiary classification from an observation even when its arithmetic is fully reproducible. Authoritative estimates also retain uncertainty arising from rounding, national reporting practices, and incomplete coverage.
The principal limitations are uneven source coverage, differences in production stages and reference years, limited contemporary global mass balances, and the judgment-based nature of the vertical index. The study does not establish precise retained-stock fractions, future reserve additions, or probabilities of exhaustion. Its conclusions are strongest when distinguishing broad mechanisms of pressure and identifying where further evidence is required.
Reproducibility depends on retaining each observation’s units, date, geographic and process boundaries, source attribution, and comparison operator. Changes to a baseline require corresponding recalculation of reserve-life proxies, scenarios, and plotting values. Unverified quantities remain explicitly unresolved unless new evidence supports a compatible estimate.
The accompanying validation procedures check these internal relationships. They support consistency and traceability, while independent verification of source estimates and future outcomes remains outside the scope of those checks.
Sources and conflicts
Selected and rejected source values
Li: ArcGIS reserve rows conflict materially with complete commodity chapter (e.g. US 1.1 vs 4.4 Mt; China 3 vs 4.6 Mt). Use full chapter global 37 Mt and preserve ArcGIS evidence as nonselected.
Cu: ArcGIS Chile 190 Mt vs chapter 180 Mt; other-country values differ. Use chapter global 980 Mt.
F: ArcGIS other-country 46 Mt vs chapter 32 Mt, plus Brazil 2.5 Mt chapter value. Use chapter global 330 Mt.
P: Phosphate chapter 73 Gt vs fluorine chapter 74 Gt and differing ArcGIS country estimates. Use phosphate chapter 73 Gt for R/P; retain fluorine host-equivalent as separately reported estimate.
Te: ArcGIS numeric reserve rows conflict with chapter explicitly stating unquantifiable reserves/resources. Global reserves and R/P null; do not treat refinery capacity as reserves.
Re: Sum of numeric countries 2495 t while global reserve field says Large. Partial subtotal retained separately; global R/P null.
He: US 8500 million m3 reserve-table figure closely matches 8.49 billion m3 recoverable resources; global reserves NA. Do not aggregate resource estimate and stored inventory into world economic reserves.
Ga: Rounded China/world production both 900 t while narrative share 99%. Use 99% narrative; do not claim exact 100%.
References 34 sources
Quick findings
Five conclusions emerge from the comparison.
First, a short reserve-life proxy does not establish a near-term exhaustion date. Zinc, antimony, tin, and silver each show a current reported reserve inventory equal to roughly 18–24 years of present primary output, but that comparison excludes future discoveries, reserve conversion, price responses, substitution, recycling, and changes in demand [3][4][5][6]. It is best interpreted as an indicator of how frequently the economic inventory must be replenished, not as a prediction that mining will cease.
Second, geological abundance and material conservation are separate questions. Phosphate rock has a much longer static reserve-life proxy (approximately 292 years at current production) yet phosphorus is exposed to large diffuse flows through agriculture, food systems, soils, wastewater, and aquatic sinks [7][8][9]. Helium presents the clearest physical contrast: once vented into the atmosphere, it becomes extraordinarily difficult to reconcentrate, while recovery systems can retain most of an institution’s operating inventory before release [10][11].
Third, several technologically important materials do not support a defensible global reserve-life calculation at all. Tellurium, indium, germanium, gallium, and rhenium are strongly linked to the mining or processing of host commodities. Their supply can be limited by host-mineral throughput, refinery configuration, recovery equipment, purification capacity, and commercial incentives before geological occurrence becomes the binding constraint [12][13][14][15][16].
Fourth, high-volume transition materials are primarily a scale-and-timing problem. Copper combines a reported reserve-life proxy of approximately 42.6 years with 23 million tonnes of 2025 mine production and rising demand expectations.[17] Lithium has a much longer current proxy (approximately 127.6 years) but its denominator omits withheld United States output and projected 2050 demand in the International Energy Agency’s Stated Policies Scenario is four times the reported 2025 mine-output baseline used here [18][19]. In both cases, project delivery, processing capacity, product lifetimes, and the delayed release of end-of-life scrap matter more than a static exhaustion date.
Fifth, anthropogenic stocks are not automatically circular supply. Copper in buildings and power equipment, lithium in batteries, rhenium in turbine superalloys, and uranium in enrichment tails or used fuel remain physically present after initial use.[16][17][18][20] Whether those stocks become usable secondary supply depends on product retirement, collection, sorting, concentration, metallurgical yield, economics, regulation, and in uranium’s case, fuel-cycle policy and isotopic composition [1][20].
How to read the visualization
The chart is intentionally multidimensional because no single statistic captures resource depletion.
The horizontal axis is the current reserve-life proxy, calculated as reported reserves divided by annual primary production. It uses a logarithmic scale so that shorter and longer inventories can be shown together. Lower-bound reserve estimates for antimony, tin, and tungsten remain lower bounds in the chart; they are not silently converted into exact values [1][4][5][21].
The vertical axis is a 0–100 ordinal screening index constructed from three components: exposure to dispersion, practical recovery barriers, and loss of economic recoverability. It is not a measured percentage of material lost. Each component is rated from zero to four, and the displayed sensitivity bars show the effect of moving every component by one ordinal point. Those bars are judgment ranges, not statistical confidence intervals [1].
The bubble area represents annual contained-element throughput. This emphasizes the difference between, for example, copper’s industrial scale and rhenium’s small but strategically important flow. Phosphate rock and fluorspar are converted to elemental phosphorus and fluorine using disclosed assay assumptions; germanium has no bubble because a verified global production mass was not available [1][7][22].
Only nine of the 16 materials have a sufficiently comparable global reserve value and production denominator to appear on the horizontal axis. Helium, tellurium, indium, germanium, gallium, rhenium, and uranium remain in an explicit unplotted panel. Their omission is a finding about data comparability, not evidence of zero reserves or zero resource pressure [1][10][12][13][14][15][16][20].
Comparative readout
| Material | Static R/P proxy | Screening index | Primary resource-system constraint | Evidence |
|---|---|---|---|---|
| Helium | Not verified | 91.3 | Capture before venting; gas-processing and storage infrastructure | [10][11] |
| Silver | 23.5 years | 50.0 | Short reported inventory, host-mine dependence, and mixed product recovery | [3][23] |
| Tin | >20.7 years | 60.0 | Solder and coating dispersion alongside meaningful recycled input | [4][24] |
| Antimony | >18.2 years | 75.0 | Chemical dispersion, strategic concentration, and uneven recovery | [5] |
| Zinc | 18.5 years | 50.0 | High-volume galvanizing losses balanced by durable metal stocks | [6][25] |
| Tellurium | Not verified | 58.8 | Copper-refinery byproduct recovery and thin-film collection | [12] |
| Indium | Not verified | 77.5 | Zinc-linked recovery and low-loading use in complex products | [13] |
| Germanium | Not verified | 68.8 | Byproduct opacity, incomplete output data, and specialized demand | [14] |
| Gallium | Not verified | 77.5 | Alumina-linked recovery, refining concentration, and weak product recycling | [15] |
| Rhenium | Not verified | 25.0 | Host-processing dependence moderated by specialist recycling | [16] |
| Tungsten | >55.3 years | 35.0 | Geographic concentration, tool wear, and recoverable engineering stock | [21] |
| Phosphorus / phosphate rock | 292 years | 85.0 | Essential nutrient dispersion despite a large reported reserve base | [7][8][9] |
| Fluorspar / fluorine | 33.0 years | 85.0 | Chemical transformation and limited closed-loop recovery | [22] |
| Copper | 42.6 years | 25.0 | Large extraction scale, project lead times, and rising demand | [17][19][26] |
| Lithium | 127.6 years* | 50.0 | Rapid demand growth, conversion capacity, and delayed battery scrap | [18][19] |
| Uranium | Not comparable | 42.5 | Fuel-cycle constraints, retained stocks, and irreversible fission | [20][27][28] |
*The lithium numerator includes United States reserves while the production denominator excludes withheld United States output, biasing the ratio upward [18].
The index values above are analyst judgments, not observed loss percentages or probabilities of depletion [1].
The resource problem changes by material
1. Short reported inventories: zinc, antimony, tin, and silver
Zinc, antimony, tin, and silver occupy the short-inventory region of the plotted sample. Their reported reserve-life proxies cluster between approximately 18 and 24 years, but the similarity ends there [3][4][5][6]. Zinc is a 13-million-tonne-per-year industrial metal used extensively in galvanizing, where much of the metal remains attached to long-lived steel but may be lost or diluted during use and recycling [6][25]. Antimony is a much smaller flow, with chemical and flame-retardant applications that can disperse it through complex products, even as lead-antimony battery streams provide an established recovery pathway [5].
Tin illustrates why recycling denominators require care. The International Tin Association reports a 33.4% recycling input rate for 2023, but that figure includes secondary refined and unrefined tin as well as manufacturing scrap; it is not a global end-of-life recovery rate [24]. Tin in solder, tinplate, chemicals, and bronze enters very different recovery systems. A tonne in segregated alloy scrap is not equivalent to a small mass distributed across millions of electronic assemblies [4][24].
Silver likewise combines high-value recoverable stocks with substantial low-loading applications. The Silver Institute reports 193.9 million troy ounces, approximately 6,031 tonnes of recycled supply in 2024, equal to about 19.1% of that year’s mine-plus-recycling flow [23]. That is a secondary-supply share, not a collection-efficiency measure. Bullion, jewelry, and large catalysts can remain concentrated, while photovoltaic metallization, electrical contacts, brazing alloys, and biocidal uses impose different separation costs [3][23].
The strategic implication is not that reserve replacement, mine development, product design, and recovery systems must repeatedly compensate for a comparatively small reported economic inventory [1][3][4][5][6].
2. Capture and diffuse-use systems: helium, phosphorus, and fluorine
Helium is the clearest example of avoidable dissipation. The 2026 USGS chapter reports approximately 190 million cubic metres of global 2025 production at specified reference conditions, but it does not provide a comparable global economic reserve total [10]. Our data therefore rejects a global R/P value rather than reclassifying United States recoverable resources or stored inventory as reserves [1][10]. The operational priority is conservation at the point of use: ETH Zurich and the University of Zurich report approximately 85% reuse in their institutional recovery system, demonstrating the potential of a local closed loop without implying an 85% global recycling rate [11].
Phosphorus presents the opposite inventory profile. USGS reports 73 billion tonnes of phosphate-rock reserves against 250 million tonnes of 2025 production, producing a static proxy of 292 years [7]. Yet phosphorus has no substitute in biological systems, and agricultural application distributes it across crops, livestock, soils, waste streams, and waterways [8][9]. A 2013 global assessment summarized in Our Phosphorus Future found that approximately 6 million tonnes of phosphorus, or 85% of the phosphorus in human excreta and other human waste in that assessment, was not recycled [9]. The figure describes a specific waste boundary, not the fraction of all mined phosphorus lost, but it demonstrates why a long geological inventory does not eliminate the need for recovery.
Fluorine, represented in the production and reserve data by fluorspar, combines a roughly 33-year static proxy with extensive chemical use [22]. Fluorine atoms are not necessarily destroyed when fluorinated compounds are consumed, but dilution, reaction products, mixed wastes, and low-value residues can make functional recovery impractical [1][22]. For both phosphorus and fluorine, the relevant question is not only how much material exists, but whether industrial and environmental systems preserve a sufficiently concentrated recovery pathway.
3. Byproduct and refinery constraints: tellurium, indium, germanium, gallium, and rhenium
The specialty-metal group exposes a major limitation of conventional depletion graphics. Tellurium is predominantly recovered through copper-refining systems; indium is associated principally with zinc-bearing feed and refinery circuits; germanium can be recovered from zinc materials and selected coal-related streams; gallium is commonly recovered from bauxite and alumina processing; and rhenium is linked to molybdenum-bearing copper concentrates and downstream processing [12][13][14][15][16].
For these materials, crustal occurrence is only the first layer of availability. A host mine may operate without recovering the trace metal. A refinery may route residues away from recovery. Installed circuits may lack the scale, purity, or economics required for separation. Demand for the byproduct can rise without creating enough revenue to alter the host commodity’s production plan [1][12][13][14][15][16].
The dataset consequently leaves global reserves and reserve-life values unverified where the underlying commodity source does not support a comparable total. Tellurium is a particularly important case: the complete USGS commodity chapter states that reserves and resources cannot be reliably quantified, so out data rejects conflicting legacy-style numerical rows rather than converting refinery capacity into reserves [1][12]. Rhenium’s published world reserve field is qualitative, while its numerical country entries form only a partial subtotal; the dataset therefore preserves the subtotal but does not present it as a complete global denominator [1][16].
Rhenium also shows why byproduct dependence does not imply uniformly poor circularity. USGS estimates 20–25 tonnes of secondary rhenium in 2025, excluding closed catalyst loops, alongside 81 tonnes of primary recovered output.[16] This corresponds to approximately 19.8–23.6% of the measured primary-plus-secondary boundary used in our data, reflecting the value and concentration of rhenium-bearing superalloy and catalyst streams [1][16]. Gallium or indium distributed at low loading in complex products faces a different recovery proposition [13][15].

4. Throughput and stock formation: copper, lithium, and tungsten
Copper’s bubble is large because scale is central to its risk profile. USGS estimates 23 million tonnes of 2025 mine production and 980 million tonnes of reported reserves [17]. At constant output, a purely arithmetic 100-year case would involve 2.3 billion tonnes of primary copper (more than twice the current reserve inventory) but that is not a forecast of extraction or a claim that today’s reserve base must supply the entire century [1][17]. Reserves can expand, demand can change, and secondary supply can displace some primary requirements.
Demand scenarios nevertheless show why timing matters. The IEA projects 37 million tonnes per year of refined copper demand in 2050 under its Stated Policies Scenario, excluding direct-use scrap, while BHP projects broader copper demand above 50 million tonnes per year [19][26]. Those figures use different boundaries and should not be presented as a single statistical range. The IEA also estimates that expanded recycling could reduce the need for new copper mine development by approximately 35% in 2050 under the cited comparison, but this is not equivalent to saying that recycled material supplies 35% of all copper demand [19].
Lithium’s current static proxy is much longer, yet the demand transition is much steeper. USGS reports 290,000 tonnes of 2025 mine production excluding withheld United States output and 37 million tonnes of global reserves [18]. The IEA’s Stated Policies Scenario reaches 1.16 million tonnes of annual lithium demand by 2050, with still higher values under more ambitious climate scenarios [19]. Battery deployment simultaneously creates a future anthropogenic stock and delays its availability: material placed into a long-lived vehicle or stationary battery cannot return as scrap until the product retires and enters an effective collection and processing system [1][18][19].
Tungsten lies between the specialty-metal and engineering-stock cases. Its reported reserves exceed 4.7 million tonnes and its 2025 production is approximately 85,000 tonnes, yielding a lower-bound proxy above 55 years [21]. Cemented-carbide tools and high-value alloys support established recycling pathways, while wear losses and dispersed applications reduce recoverability. Concentrated mining and processing remain strategic constraints distinct from depletion [21].
5. Uranium: transformation, retention, and fuel-cycle choice
Uranium does not fit cleanly into a conventional metal-recycling framework. The OECD Nuclear Energy Agency and the International Atomic Energy Agency report identified recoverable resources by cost category rather than a directly comparable USGS-style world reserve figure; we therefore do not calculate a global R/P value [20]. The same source reports 61,924 tonnes of 2024 mine production and projects 84,800–143,900 tonnes of annual reactor requirements in 2050 under low- and high-growth cases [20].
Only the atoms that undergo nuclear reactions are irreversibly transformed. Much of the natural-uranium feed remains in enrichment tails or used fuel. The World Nuclear Association records approximately 1.2 million tonnes of depleted uranium at the end of 2018 and describes typical used fuel as roughly 96% uranium by mass [27][28]. Neither figure is a recycling rate, and neither implies that the retained material can substitute immediately for newly mined uranium. Isotopic composition, radiation fields, processing infrastructure, reactor design, economics, safeguards, and policy determine whether those anthropogenic stocks become future fuel [20][27][28],
What the century scenarios show
Our research applies three common primary-output stress tests to every material with a verified production baseline. The conservation case declines from the 2026 baseline to 75% in 2050 and then falls by 0.5% annually. The constant case holds output at the baseline for 100 years. The expansion case rises linearly to twice the baseline in 2050 and then remains constant. Across the 2026–2125 interval, these paths equal approximately 68.64, 100, and 187.5 baseline-production years [1].
At constant output, the arithmetic totals include 2.3 billion tonnes of copper, 29 million tonnes of lithium, 25 billion tonnes of phosphate rock, and 2.6 million tonnes of silver [1][3][7][17][18]. These are extraction-equivalent stress tests, not demand forecasts. They do not model price, substitution, inventory changes, processing losses, new discoveries, material-specific technology transitions, or the release of secondary supply. The common expansion path is especially unsuitable as a lithium forecast because the IEA’s published 2050 demand scenario rises faster than that generic pathway [1][19].
The scenarios are most useful when interpreted as accounting questions: how much primary output would a specified path require; how many times would the present reported reserve inventory have to turn over; and how much of the extracted material would remain in accessible products, infrastructure, scrap, tailings, waste streams, or environmental sinks? They should not be converted into calendar-year depletion claims.
Strategic implications
Prevent dispersal before attempting recovery
The highest-value intervention for helium is capture before venting. For phosphorus, improved nutrient efficiency and recovery from concentrated manure, food-processing, and wastewater streams are generally more tractable than recapturing phosphorus after it has reached diffuse waters or sediments. Fluorine recovery is likewise more plausible from concentrated industrial streams than from widely dispersed end products [8][9][11][22].
Treat byproduct supply as a processing-system problem
For tellurium, indium, germanium, gallium, and rhenium, supply assessments should track host production, residue routing, refinery configuration, installed recovery capacity, yields, and purification capability. Reserve tonnage alone (where it exists) cannot show whether the material will actually be recovered [12][13][14][15][16].
Design products as future ore bodies
Durable products can transfer material from geological deposits into an anthropogenic stock, but only deliberate design and collection make that stock recoverable. Material passports, easier disassembly, reduced alloy contamination, standardized battery logistics, and contracts that preserve ownership or take-back rights can improve the quality of future secondary feed [1][17][18][19].
Separate recycling metrics
End-of-life recycling rate, recycling input rate, secondary-supply share, collection rate, and plant recovery yield answer different questions. Tin’s 33.4% recycled input, silver’s 19.1% share of mine-plus-recycling flow, and the historical UNEP end-of-life bands should not be placed on one chart as though they measured the same process [1][23][24][29].
Track concentration independently from depletion
A material can have a long geological inventory and still be strategically vulnerable if mining, refining, or purification is concentrated. Conversely, a short reported reserve inventory may coexist with diversified production and strong recycling. Geological scarcity, industrial concentration, substitution difficulty, and dissipation should remain separate analytical variables [1][15][17][18][20].
Methodological review and data quality
The release contains 16 material profiles, 34 source records, 48 common scenarios, 4,800 annual scenario rows, 101 explicit data-gap records, and eight documented source conflicts. Its validation suite passes 17 structural and calculation checks, including preservation of comparison operators, exclusion of refinery capacity from reserve fields, rejection of cost-tier uranium resources as reserves, and verification of the retained source-document hash [1].
The most consequential source decisions are transparent. Complete USGS commodity chapters are selected over conflicting ArcGIS reserve rows for lithium, copper, fluorspar, and phosphate rock; the phosphate chapter’s 73-billion-tonne value is used for the phosphate-rock R/P calculation; and a separately reported fluorine-host estimate is not substituted into that denominator [1][7][17][18][22]. Numeric R/P values remain null for tellurium, rhenium, helium, and the other materials lacking comparable global reserves [1][10][12][16].
All 16 profiles carry an overall confidence rating of C, reflecting the difference between relatively strong production and reserve observations and much weaker global evidence for current dissipation fractions, retained-stock masses, comparable end-of-life recovery, century-scale demand, and reserve additions [1]. This is not a judgment that all individual fields are low quality. Production and reserve values for several major commodities are rated A; the overall rating is constrained by the wider analytical question.
The most important limitation is the vertical axis. It is a transparent screening construct, not an empirical global mass balance. The underlying concepts are directionally useful, but the wide, overlapping sensitivity bands mean that a five- or ten-point difference should not be interpreted as a precise ranking [1]. The chart is designed to separate broad regimes (highly dissipative systems, mixed-retention metals, and durable engineering stocks) not to claim that one material is exactly 12.5% more irreversible than another.
Conclusion
No credible analysis can identify a single date on which humanity “runs out” of copper, silver, lithium, phosphorus, or most other mineral commodities. What can be identified are the mechanisms that make continued service progressively harder: a small economic reserve inventory, rapidly expanding throughput, slow project delivery, host-commodity dependence, refining concentration, difficult substitution, diffuse use, weak collection, or the loss of material into forms that are technically or economically impractical to recover [1][2].
That distinction changes the policy and investment question. The objective is not merely to add tonnes of reserves. It is to preserve optionality across the entire material system: discover and convert resources where needed; capture valuable byproducts at the refinery; use materials efficiently; prevent avoidable dispersal; design products for recovery; and build secondary-supply systems before the first large wave of new infrastructure reaches end of life [1][19].
The most durable conclusion is simple: finite materials do not share one depletion pathway. Some are consumed at enormous scale but remain concentrated in cities and infrastructure. Some occur in large geological inventories yet are dispersed through biological or chemical systems. Some are geologically widespread but available only when another industry chooses to recover them. The future availability of nonrenewable materials will depend as much on the architecture of human systems as on the contents of the Earth’s crust [1].
References
[1] DataDeep Research - Nonrenewable Resource Depletion, Dissipation, and Anthropogenic Stocks: Methods and Interpretation. 18 October 2026.
[2] U.S. Geological Survey. Mineral Commodity Summaries 2026. February 2026. https://pubs.usgs.gov/publication/mcs2026
[3] U.S. Geological Survey. Mineral Commodity Summaries 2026 — Silver, pp. 172–173 (printed pagination). February 2026. https://pubs.usgs.gov/periodicals/mcs2026/mcs2026-silver.pdf
[4] U.S. Geological Survey. Mineral Commodity Summaries 2026 — Tin, pp. 194–195. February 2026. https://pubs.usgs.gov/periodicals/mcs2026/mcs2026-tin.pdf
[5] U.S. Geological Survey. Mineral Commodity Summaries 2026 — Antimony, pp. 42–43. February 2026. https://pubs.usgs.gov/periodicals/mcs2026/mcs2026-antimony.pdf
[6] U.S. Geological Survey. Mineral Commodity Summaries 2026 — Zinc, pp. 212–213. February 2026. https://pubs.usgs.gov/periodicals/mcs2026/mcs2026-zinc.pdf
[7] U.S. Geological Survey. Mineral Commodity Summaries 2026 — Phosphate Rock, pp. 142–143. February 2026. https://pubs.usgs.gov/periodicals/mcs2026/mcs2026-phosphate.pdf
[8] UK Centre for Ecology & Hydrology and contributing authors. Our Phosphorus Future — Chapter 6. 2022. https://www.opfglobal.com/chapter6
[9] UK Centre for Ecology & Hydrology and contributing authors. Our Phosphorus Future — Chapter 7. 2022. https://www.opfglobal.com/chapter7
[10] U.S. Geological Survey. Mineral Commodity Summaries 2026 — Helium, pp. 96–97. February 2026. https://pubs.usgs.gov/periodicals/mcs2026/mcs2026-helium.pdf
[11] ETH Zurich. “How ETH Zurich Is Responding to the Global Helium Shortage.” 15 April 2026. https://ethz.ch/staffnet/en/news-and-events/internal-news/archive/2026/04/how-eth-zurich-is-responding-to-the-global-helium-shortage.html
[12] U.S. Geological Survey. Mineral Commodity Summaries 2026 — Tellurium, pp. 188–189. February 2026. https://pubs.usgs.gov/periodicals/mcs2026/mcs2026-tellurium.pdf
[13] U.S. Geological Survey. Mineral Commodity Summaries 2026 — Indium, pp. 98–99. February 2026. https://pubs.usgs.gov/periodicals/mcs2026/mcs2026-indium.pdf
[14] U.S. Geological Survey. Mineral Commodity Summaries 2026 — Germanium, pp. 88–89. February 2026. https://pubs.usgs.gov/periodicals/mcs2026/mcs2026-germanium.pdf
[15] U.S. Geological Survey. Mineral Commodity Summaries 2026 — Gallium, pp. 82–83. February 2026. https://pubs.usgs.gov/periodicals/mcs2026/mcs2026-gallium.pdf
[16] U.S. Geological Survey. Mineral Commodity Summaries 2026 — Rhenium, pp. 156–157. February 2026. https://pubs.usgs.gov/periodicals/mcs2026/mcs2026-rhenium.pdf
[17] U.S. Geological Survey. Mineral Commodity Summaries 2026 — Copper, pp. 72–73. February 2026. https://pubs.usgs.gov/periodicals/mcs2026/mcs2026-copper.pdf
[18] U.S. Geological Survey. Mineral Commodity Summaries 2026 — Lithium, pp. 118–119. February 2026. https://pubs.usgs.gov/periodicals/mcs2026/mcs2026-lithium.pdf
[19] International Energy Agency. Global Critical Minerals Outlook 2025, pp. 100, 108, 120. 2025. https://iea.blob.core.windows.net/assets/ef5e9b70-3374-4caa-ba9d-19c72253bfc4/GlobalCriticalMineralsOutlook2025.pdf
[20] OECD Nuclear Energy Agency and International Atomic Energy Agency. “Adequate Uranium Resources Available, but Sustained Investment Essential to Support Global Nuclear Capacity Growth.” 14 September 2026. https://www.oecd-nea.org/jcms/pl_121582/adequate-uranium-resources-available-but-sustained-investment-essential-to-support-global-nuclear-capacity-growth
[21] U.S. Geological Survey. Mineral Commodity Summaries 2026 — Tungsten, pp. 200–201. February 2026. https://pubs.usgs.gov/periodicals/mcs2026/mcs2026-tungsten.pdf
[22] U.S. Geological Survey. Mineral Commodity Summaries 2026 — Fluorspar, pp. 80–81. February 2026. https://pubs.usgs.gov/periodicals/mcs2026/mcs2026-fluorspar.pdf
[23] Silver Institute and Metals Focus. “Silver Supply and Demand / World Silver Survey 2025.” 2025. https://silverinstitute.org/silver-supply-demand/
[24] International Tin Association. “Tin Recycling.” 2023 recycling-input-rate data. https://www.internationaltin.org/recycling/
[25] International Zinc Association. “Zinc Circularity.” Accessed 18 September 2026. https://www.zinc.org/circularity-2/
[26] BHP. “Economic and Commodity Outlook: Copper.” 18 August 2026. https://www.bhp.com/investor-hub/reports-and-presentations/economic-and-commodity-outlook/2026/08/economic-and-commodity-outlook
[27] World Nuclear Association. “Supply of Uranium.” Accessed 18 September 2026. https://world-nuclear.org/information-library/nuclear-fuel-cycle/uranium-resources/supply-of-uranium
[28] World Nuclear Association. “Processing of Used Nuclear Fuel.” 23 August 2024. https://world-nuclear.org/information-library/nuclear-fuel-cycle/fuel-recycling/processing-of-used-nuclear-fuel
[29] UNEP International Resource Panel. Recycling Rates of Metals: A Status Report, Table F1. 2011. https://www.resourcepanel.org/file/381/download?token=he_rldvr
Editorial note
Reserve-life values are static inventory-to-flow proxies, not exhaustion dates. The vertical index is an analyst screening construct, not a measured loss percentage. “Not verified” means that we did not identify a comparable value within its evidence boundary; it does not mean zero.