
Off-Grid Solar Homesteading Costs in 2026: System Economics, Battery Chemistry, and Risk Across 3, 6, and 12-Person Households
Off-grid solar costs at three household scales, with DIY versus professional pathways, LFP versus lead-acid economics, and a full risk analysis.

A Layman's Guide to Solar Powered Homesteading: Energy Fundamentals, System Economics, and Risk Analysis Across Household Scales
1. Summary
Residential off-grid solar-plus-storage has matured into a capital-intensive but technically tractable proposition for households willing to undertake substantive engineering planning, regulatory navigation, and ongoing operations responsibility. This report evaluates the economics, technology, and risk profile of homestead-scale solar power across three representative household sizes, drawing on the most recent benchmark data from the National Renewable Energy Laboratory (NREL), Lawrence Berkeley National Laboratory (LBNL), the U.S. Energy Information Administration, the International Energy Agency (IEA), BloombergNEF (BNEF), Wood Mackenzie, the Solar Energy Industries Association (SEIA), and the EnergySage marketplace. The analysis is conducted in a posture of analytical neutrality: it neither advocates for off-grid living nor dismisses it, but rather seeks to quantify the trade-offs that confront prospective adopters, policymakers, and capital allocators.
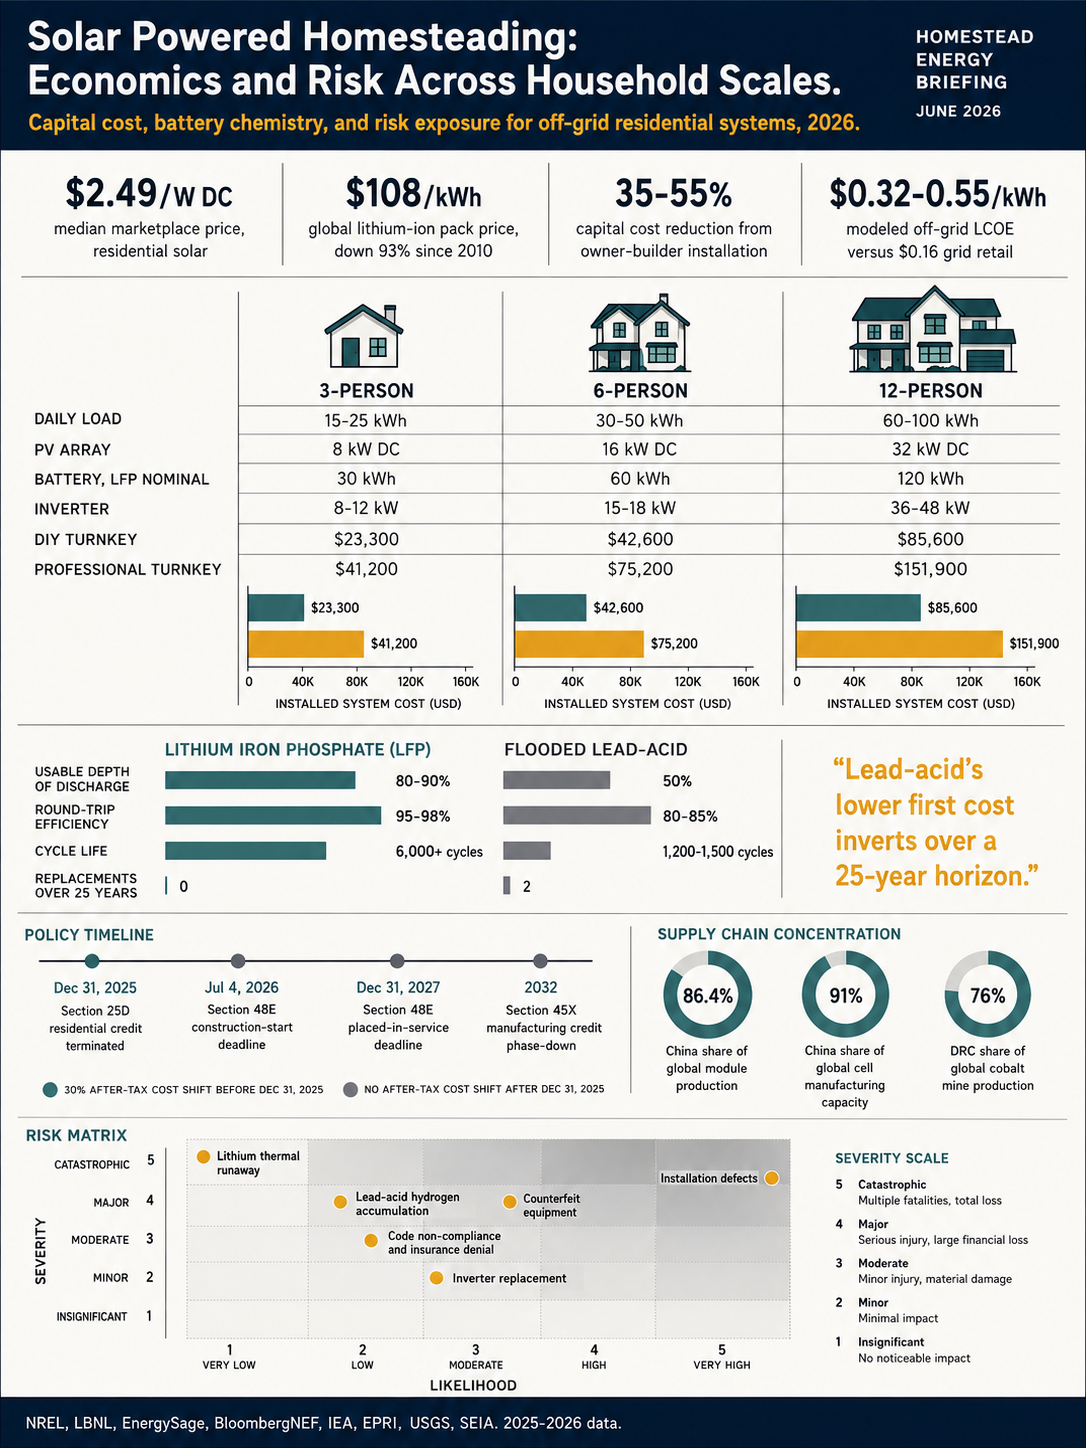
The headline economic finding is that median grid-connected residential solar pricing reached approximately $2.49 per watt direct current (W DC) on the EnergySage marketplace through 2025, compared with a roughly $3.50/W DC national median measured by LBNL's Tracking the Sun for cash purchases of systems installed in 2024 [1][2]. Off-grid homestead systems sit substantially above these figures because of the additional storage, generator backup, balance-of-system hardware, and labor required to operate without utility interconnection. For a three-person homestead with a 15 to 25 kWh per day load, professionally installed solar-plus-storage off-grid configurations typically fall between $45,000 and $75,000 turnkey, depending on chemistry and geography. A six-person homestead at 30 to 50 kWh per day generally falls between $75,000 and $130,000, and a twelve-person homestead at 60 to 100 kWh per day between $140,000 and $260,000. Owner-builder (DIY) installation can compress capital cost by 35 to 55 percent, but transfers substantial design, code-compliance, and operational risk to the homeowner.
A second headline conclusion concerns battery chemistry. Industry consensus and BNEF's 2025 Lithium-Ion Battery Price Survey, which recorded volume-weighted pack prices at $108 per kilowatt-hour globally and stationary-storage pack prices at $70/kWh, confirm that lithium iron phosphate (LFP) chemistries have decisively displaced lead-acid for new residential deployments on a 25-year total cost of ownership basis [3]. Although flooded lead-acid hardware retains a modest first-cost advantage, its lower depth of discharge (typically 50 percent), reduced round-trip efficiency (approximately 80 to 85 percent), and shorter cycle life (1,200 to 1,500 cycles at 50 percent depth of discharge (DoD) on premium models) translate into two to three replacement cycles over a 25-year operating horizon. LFP systems, by contrast, deliver 95 to 98 percent round-trip efficiency, 80 to 90 percent usable depth of discharge, and 6,000-cycle ratings from manufacturers such as EG4 and BYD, allowing a single battery bank to span the full PV-system lifetime under typical residential cycling [4][5].
The principal risk vectors identified in this analysis cluster into five domains: lithium-ion thermal runaway and battery-fire propagation; lead-acid hydrogen off-gassing and ventilation failure; installation defects from owner-builder workmanship (improper conductor sizing, inadequate grounding, polarity reversals); counterfeit or unlisted equipment from informal DIY supply channels; and code-compliance/insurance disputes following inadequate permitting. Empirical data from the Electric Power Research Institute's (EPRI) Battery Energy Storage Systems Failure Incident Database indicate that the rate of battery storage incidents per gigawatt-hour deployed has fallen by approximately 98 percent between 2018 and 2024 as design and construction practice matured, but the absolute consequence of a single residential thermal-runaway event remains severe [6]. The 2025 passage of the One Big Beautiful Bill Act (OBBBA) terminated the Section 25D Residential Clean Energy Credit for expenditures made after December 31, 2025, altering the after-tax economics of any homesteading investment evaluated for installation in 2026 or later [7][8]. Third-party-owned residential solar (leases and power purchase agreements) under Section 48E remained eligible through projects placed in service by December 31, 2027, provided construction began by July 4, 2026 [7][9].
Taken together, the evidence suggests that solar-powered homesteading is technically viable and increasingly cost-competitive at the smaller residential scales, but that the post-IRA policy reversal, ongoing tariff-driven module and battery price volatility, and the operational discipline required to manage a high-voltage DC system with stored chemical energy mean that prospective adopters should approach the decision with rigor.
What Does Off-Grid Solar Cost? A 2026 Analysis of System Economics, Battery Chemistry, and Risk at Three Household Scales
2. Contextual Background
2.1 The Evolution of Residential Solar PV
Residential photovoltaic (PV) deployment in the United States has expanded from a niche application in the early 2000s, when system pricing exceeded $8/W DC and the technology was concentrated in a handful of states with generous rebate structures, into a market that installed approximately 4.6 GW DC of residential capacity in 2025 alone [10]. The trajectory has been driven by three reinforcing forces: a structural decline in module manufacturing costs as Chinese capacity scaled, the introduction of the federal Investment Tax Credit and its successor under the Inflation Reduction Act of 2022, and the maturation of an installer ecosystem capable of executing tens of thousands of rooftop projects per year. NREL's 2024 Annual Technology Baseline (ATB) and corresponding Q1 2024 cost benchmark place the modeled CAPEX for a representative 8 kW DC residential system, before incentives, in the range of approximately $2.74 to $4.00/W DC depending on whether the metric reflects minimum sustainable price or modeled market price [11][12]. Module efficiency in benchmark residential systems reached 21.1 percent in NREL's 2024 reference case, with 400 W modules now standard, and EnergySage data through late 2025 show 430 to 460 W modules dominating actual installations [11][2].
The grid-connected segment, however, is only a partial proxy for off-grid homesteading economics. Residential systems sold through utility-interconnected channels rely on net energy metering or net billing tariffs to monetize excess generation, and they typically omit the storage and generator infrastructure that off-grid operation requires. Tracking the Sun, LBNL's longitudinal pricing survey of distributed solar covering roughly 4.5 million systems installed through 2024, documents median pricing of approximately $3.5/W DC for cash-purchased grid-tied residential systems, with non-residential systems clustering between $2.0 and $2.5/W DC [1]. EnergySage marketplace pricing, which is structurally lower because it reflects competitive quotes rather than walk-up retail, settled at $2.49/W DC for the second half of 2025, with storage attached to 38 percent of quoted projects nationally and as high as 79 percent in California under the net billing tariff [13].
2.2 The Modern Homesteading Movement and Energy Independence
The contemporary homesteading movement, while culturally diverse, shares a recurring economic motif: the substitution of grid services with self-produced or self-stored alternatives, including water (well and cistern), food (gardens and livestock), heat (wood, biomass, or solar thermal), and electricity (PV with battery storage and, frequently, a generator backup). The movement's energy posture is heavily influenced by perceived grid fragility (extreme weather events, wildfire-driven public safety power shutoffs, prolonged outages), retail electricity rate inflation, and a desire for operational autonomy. Evidence presented by EnergySage in its February 2026 marketplace report indicates that "energy independence" has become a more frequently cited motivation among prospective residential solar customers following the 2025 termination of the federal residential tax credit, partially offsetting the demand contraction that the policy reversal would otherwise have produced [13].
 John D
2.3 Cost Curves: Modules, Inverters, and Storage from 2010 to 2026
Three cost curves frame the homesteading economics. First, crystalline-silicon module spot prices have declined by more than 80 percent over the 2010-to-2024 period according to IEA tracking, with Chinese-origin modules reaching wholesale levels below $0.20/W DC in 2024 before tariff-related price increases began affecting U.S. landed costs in 2025 [14][15]. Second, residential inverter pricing has decoupled across topologies: microinverters (Enphase) and DC optimizers (SolarEdge) command a premium that is partially offset by module-level monitoring and code-compliant rapid shutdown, while string and hybrid off-grid inverters from Sol-Ark, EG4, Schneider, and Victron occupy a different competitive niche oriented to backup, off-grid, and battery-coupled applications. Third, lithium-ion battery pack prices have declined by 93 percent since 2010, reaching a volume-weighted global average of $108/kWh in 2025; stationary-storage pack prices specifically reached $70/kWh, a 45 percent year-over-year decline driven by Chinese cell manufacturing overcapacity and the displacement of nickel-manganese-cobalt (NMC) by LFP chemistries in this segment [3][16]. Battery turnkey system pricing remains substantially higher than pack pricing because of the integrator margin, balance of system, and installation labor; BNEF's 2024 Battery Storage System Cost Survey placed the U.S. turnkey average at $236/kWh in 2024, with EnergySage marketplace pricing for residential batteries at $1,074/kWh fully installed in H2 2025 [3][13].
2.4 Grid-Tied, Hybrid, and Off-Grid Configurations Defined
A grid-tied (grid-interactive) PV system exports excess generation to the utility and draws from the utility when generation falls short, with no native ability to operate during a grid outage; this is the simplest, lowest-cost configuration but is unavailable to homesteaders without utility service. A hybrid system adds battery storage and an inverter capable of "islanding" the home during grid outages while still operating in grid-parallel mode under normal conditions. A fully off-grid system has no utility connection; it must be sized to meet 100 percent of household load through some combination of PV generation, battery storage, and backup generation (typically propane, diesel, or biofuel), and its design must accommodate the longest credible run of low-irradiance days for the site's climate. Off-grid operation imposes the greatest engineering and economic burden because the system must be sized for worst-case rather than average-case conditions, and because the cost of unserved energy is borne entirely by the homeowner. NEC Article 710 governs stand-alone systems, while NEC Article 690 governs PV systems and Article 706 governs energy storage systems greater than 1 kWh; all three articles apply concurrently to a typical homestead installation [17][18].
 John D
3. Energy and Power Fundamentals for the Layman
3.1 Energy Versus Power: A Conceptual Foundation
The single most consequential conceptual distinction in residential solar design is between energy and power. Power is the instantaneous rate at which electrical work is performed, measured in watts (W) or kilowatts (kW); energy is the cumulative quantity of electrical work performed over a time interval, measured in watt-hours (Wh) or kilowatt-hours (kWh). A 1,500 W microwave oven and a 1,500 W electric kettle have identical instantaneous power demand, but if the microwave runs for 6 minutes and the kettle for 3 minutes, the microwave consumes 0.15 kWh of energy while the kettle consumes 0.075 kWh. Solar systems are sized by power (kW DC of array, kW AC of inverter) but provisioned to satisfy energy (kWh per day of household consumption). Conflating the two is a common reason for under-provisioned systems.
3.2 Kilowatts and Kilowatt-Hours in Practical Application
A practical analytical reference: a 1 kW continuous load running for 24 hours consumes 24 kWh; a 100 W LED lighting circuit running for 5 hours per evening consumes 0.5 kWh per day; a 4,500 W electric water heater operating for 2 hours per day consumes 9 kWh. The U.S. average residential customer consumes approximately 10,500 kWh annually, or 28.8 kWh per day, but homesteading households exhibit substantially wider variance because of their tendency to electrify functions (well pumps, freezers, propane substitutes) that suburban households outsource to the grid or to fossil-fuel infrastructure.
3.3 Load Profiling and Daily Consumption Estimation
A sensible system design begins with an itemized load profile rather than a rule of thumb. For each load, the designer documents the rated wattage, expected duty cycle (hours per day of operation), and seasonal variation. The product yields daily energy consumption per load; the sum across all loads yields daily household kWh; the peak coincident demand (highest simultaneous draw) sets the inverter sizing. An example for a six-person homestead may include: a refrigerator (150 W cycling at 30 percent duty = 1.08 kWh/day), a chest freezer (120 W at 25 percent duty = 0.72 kWh/day), a deep well pump (1,500 W operating 1 hour/day = 1.5 kWh/day), LED lighting across 14 fixtures (140 W average for 5 hours = 0.7 kWh/day), an induction cooktop (1,800 W for 1.5 hours = 2.7 kWh/day), a washing machine (500 W for 1 hour, 4 days/week, average 0.29 kWh/day), domestic hot water via heat pump (1,200 W average for 4 hours = 4.8 kWh/day), miscellaneous electronics and chargers (200 W base for 16 hours = 3.2 kWh/day), and seasonal heating-and-cooling auxiliaries (variable, often 5 to 20 kWh/day). Summed, this profile yields approximately 35 kWh/day in shoulder season and 50 kWh/day in summer cooling, which is consistent with the report's 30 to 50 kWh range for a six-person scenario.
3.4 Capacity Factor, Solar Irradiance, and Geographic Variability
Solar capacity factor is the ratio of actual energy output over a period to the energy that would have been produced at continuous nameplate operation. NREL's PVWatts model and the National Solar Radiation Database (NSRDB) provide location-specific peak sun hour (PSH) values that translate nameplate rating into expected daily generation [19]. Annual residential capacity factors typically range from approximately 15 percent in the Pacific Northwest and Northeast to over 22 percent in the desert Southwest, corresponding to roughly 3.5 to 6.0 PSH per day. Using NREL's standard derate factor of 0.77 (incorporating inverter efficiency, wiring losses, soiling, and module mismatch), a 10 kW DC system in a 5 PSH location produces approximately 10 × 5 × 365 × 0.77 = 14,053 kWh/year, or 38.5 kWh/day on annual average. Off-grid system designers, however, must size to the worst month rather than the annual average, which for a Northern-tier site can be 40 to 50 percent below the annual mean and is the principal driver of array oversizing in homestead applications.
3.5 Battery Concepts: Depth of Discharge, Round-Trip Efficiency, Cycle Life
Three battery parameters dominate the economic comparison between chemistries. Depth of discharge (DoD) is the percentage of nominal capacity that is routinely cycled; lead-acid batteries are conventionally limited to 50 percent DoD to preserve cycle life, while LFP batteries are routinely cycled to 80 to 90 percent DoD. Round-trip efficiency (RTE) is the ratio of energy retrieved from the battery to energy delivered to it; lead-acid RTE is typically 80 to 85 percent, while LFP RTE is 95 to 98 percent at the cell level (system-level AC-coupled RTE is lower because of inverter losses). Cycle life is the number of charge-discharge cycles a battery can deliver before its capacity declines below a defined threshold, conventionally 80 percent of nameplate. Trojan flooded lead-acid datasheets indicate approximately 1,200 cycles at 50 percent DoD for premium L16 deep-cycle batteries, declining sharply at deeper cycling [20]. EG4's LiFePower4 V2 server-rack LFP battery is rated at greater than 6,000 cycles at 80 percent DoD with a 10-year warranty [4][21]. Combining DoD, RTE, and cycle-life differentials, the usable lifetime energy throughput of an LFP cell is generally three to five times that of a flooded lead-acid cell of equivalent nameplate kWh, which inverts the apparent first-cost advantage of lead-acid over a 25-year horizon.
3.6 Inverter Topologies: String, Microinverter, Hybrid, and Off-Grid
Inverter topology determines system architecture and economics. String inverters aggregate one or more strings of series-connected modules into a single AC output, are inexpensive per watt, but produce a single point of failure and are sensitive to module mismatch and partial shading. Microinverters mount one inverter at each module, provide module-level MPPT and monitoring, and improve harvest under partial shading but at a meaningful cost premium and a higher rooftop component count. Hybrid inverters combine PV input, battery DC bus, and AC output in a single unit and are increasingly the standard for residential storage integration; the Tesla Powerwall 3 integrates a hybrid inverter directly with its LFP battery and reports approximately 97.5 percent round-trip efficiency for direct PV-to-home operation and approximately 89 percent for solar-to-battery-to-home cycling [22][23]. Dedicated off-grid inverters (Sol-Ark 12K/15K/18K, Victron Quattro and MultiPlus, Schneider XW Pro, EG4 18KPV) provide the additional functionality required for stand-alone operation: generator auto-start, AC-coupled and DC-coupled charging from multiple sources, deep load surge tolerance to handle motor starting, and split-phase 120/240 V output suitable for U.S. residential service. The Sol-Ark 15K, a representative high-end residential off-grid hybrid, lists at approximately $5,000 to $5,500 wholesale and provides 12 kW continuous output at 240 V AC with 19,500 W max PV input [24].
 John D
4. Key Players and Stakeholders
4.1 Module and Cell Manufacturers
The global module manufacturing market is dominated by Chinese firms. The IEA's Solar PV Global Supply Chains report and subsequent IEA-PVPS data document that China accounted for approximately 86.4 percent of global solar module production and 91 percent of global solar cell manufacturing capacity in 2024, with polysilicon, ingot, and wafer production projected to reach approximately 95 percent Chinese share based on capacity under construction [14][15]. The largest individual manufacturers include JinkoSolar, JA Solar, Trina Solar, Canadian Solar (Chinese-headquartered despite the name), LONGi, and Tongwei. U.S. domestic manufacturing has expanded under the Inflation Reduction Act's Section 45X production tax credit, with U.S. module assembly capacity rising from 42.5 GW at year-end 2024 to 65.5 GW at year-end 2025 [10]. Domestic-only or domestic-content-eligible suppliers serving the residential market include First Solar (CdTe thin-film), Qcells (Korean parent, U.S. manufacturing in Georgia), Silfab (Canadian parent, U.S. manufacturing in Washington), and Mission Solar.
4.2 Inverter and Battery System OEMs
Residential inverter vendors include Enphase (microinverters and integrated batteries), SolarEdge (DC optimizers and string inverters), Tesla (hybrid inverter integrated with Powerwall), SMA, Fronius, Schneider Electric, Sol-Ark, Outback Power, Victron Energy, EG4 Electronics, and Growatt. Battery OEMs serving the residential market include Tesla (Powerwall 3, 13.5 kWh, LFP), Enphase (IQ Battery), FranklinWH, BYD, LG (limited following 2020s recall episodes), Pylontech, Fortress Power, SimpliPhi (now part of Briggs & Stratton, with disrupted product availability), SOK, Battle Born, and EG4. EnergySage's H2 2025 data show Enphase, Tesla, SolarEdge, and FranklinWH commanding the largest residential inverter and battery market shares, with Tesla's Powerwall 3 priced on platform at approximately $926/kWh and FranklinWH having doubled marketplace share in a single reporting period [13][2].
4.3 Professional Installer Landscape
The U.S. residential solar installation industry is fragmented, with the top three national installers (historically Sunrun, SunPower-Maxeon, and Sunnova among others) collectively accounting for less than 30 percent of installations and the balance distributed across thousands of regional and local firms. EnergySage's contractor survey data through 2025 show 51 percent of installers reporting that they regularly service systems they did not install themselves, reflecting a meaningful operations-and-maintenance market emerging as early-cohort systems age and as installer bankruptcies during the post-OBBBA downturn leave systems orphaned [13]. North American Board of Certified Energy Practitioners (NABCEP) certification is the principal voluntary credential for installer technical competence, although state licensing requirements vary substantially.
4.4 DIY Component Distributors and Online Marketplaces
The DIY supply chain is anchored by a smaller set of specialized online distributors including Signature Solar (the principal U.S. EG4 distributor), Current Connected, Inverters R Us, Northern Arizona Wind & Sun, AltE Store, ShopSolarKits, Renvu, Off-Grid Stores, and SunWatts. These channels provide direct-to-consumer pricing on UL-listed inverters, batteries, modules, and balance of system, but place the burden of design, code compliance, permitting, and installation entirely on the buyer. The DIY Solar Power Forum and similar online communities provide practitioner-level technical discussion. The principal supply-chain risk in this channel is the proliferation of equipment that is either non-listed, falsely listed, or imported through gray-market channels that bypass UL evaluation.
4.5 Financing, Insurance, and Regulatory Stakeholders
Financing for purchased residential solar in the cash-and-loan segment relies on a mix of solar-specialty lenders (Sunlight Financial, GoodLeap, Mosaic, Dividend), credit unions, and traditional banks; EnergySage data show median loan rates rising to 7.5 percent in H1 2025 [25]. Insurance is typically integrated into homeowner policies but requires affirmative disclosure, particularly for ground-mounted arrays and systems with battery storage. Regulatory stakeholders include state public utility commissions (which set net metering or net billing tariffs for grid-interactive systems), authorities having jurisdiction (AHJs) that enforce NEC and IFC compliance, the Internal Revenue Service (administering Sections 25D and 48E), and the U.S. Department of the Treasury (administering Section 45X manufacturer credits and FEOC compliance under OBBBA) [7][26].
5. Technical and Operational Considerations
5.1 System Architecture and Sizing Methodology
A durable off-grid system design follows a five-step methodology. First, construct an itemized load profile (Section 3.3) and segregates loads by season. Second, apply a target days-of-autonomy figure, conventionally two to three days for grid-adjacent homesteads with generator backup and four to seven days for true wilderness sites, to size battery storage. Third, size the PV array to recharge the battery within a single solar day, with appropriate derating for irradiance, soiling, and module degradation. Fourth, size the inverter to handle peak coincident load with sufficient surge capacity for motor starting (typically three times running wattage for inductive loads). Fifth, size the generator to provide one-day full household load plus battery recharge capacity, generally 6 to 14 kW for the household scales evaluated. Each step requires sensitivity analysis around degradation, weather variability, and load growth.
5.2 Lead-Acid Battery Systems: Flooded, AGM, and Gel
Lead-acid remains a viable chemistry for cost-sensitive applications and where supply-chain disruption to lithium imports is a concern. Three subtypes dominate: flooded (vented) batteries, exemplified by Trojan T-105 (6 V, 225 Ah), Rolls/Surrette S-550, Crown CR-390, and US Battery US-2200; absorbed glass mat (AGM), exemplified by Trojan AES, Rolls AGM, and Lifeline; and gel cells, the most expensive and lowest-cycle-life of the three subtypes. Flooded batteries are the lowest cost per nameplate kWh, deliver the longest cycle life (1,200 to 1,500 cycles at 50 percent DoD), but require monthly water replenishment, equalization charging at 4 to 6 week intervals, and ventilation to mitigate hydrogen evolution [20][27]. AGM eliminates maintenance and reduces gassing but at higher first cost and shorter cycle life (500 to 1,200 cycles depending on grade). Gel batteries tolerate temperature extremes well but at the highest cost per usable kWh.
5.3 Lithium-Ion Battery Systems: LFP and NMC Chemistries
Two lithium-ion chemistries are relevant to residential storage: lithium iron phosphate (LFP, LiFePO4) and nickel-manganese-cobalt (NMC). LFP is now the dominant residential chemistry because of its superior thermal stability (decomposition onset above 250°C versus approximately 150°C for NMC), longer cycle life, lower cobalt and nickel content, and improving energy density. The Tesla Powerwall 3 transitioned to LFP from NMC in late 2023 [22]. EG4 LifePower4 V2 batteries are LFP, rated at greater than 6,000 cycles at 80 percent DoD with 10-year warranties and per-unit pricing of approximately $1,199 (5.12 kWh, equivalent to $234/kWh at retail) [4][21]. NMC retains a presence in legacy installations and where energy density per unit volume is paramount, but BNEF data show LFP commanding the cost advantage at $81/kWh average pack pricing versus $128/kWh for NMC in 2025 [3].
5.4 Balance of System and Code Compliance
The "balance of system" (BOS) encompasses everything that is not module, inverter, or battery: racking, conductors, conduit, combiner boxes, disconnects, surge protection devices, grounding electrodes, AC and DC overcurrent protection, monitoring, and labeling. NEC 2023 Article 690 governs PV-side requirements, including rapid shutdown (controlled conductors must be reduced to 80 V or less within the 1-foot array boundary and 30 V outside the boundary within 30 seconds of initiation per NEC 690.12), DC arc-fault protection above 80 V (690.11), grounding and bonding (690.43), and labeling (Part VII) [17][28]. NEC Article 706 governs energy storage systems greater than 1 kWh, requiring an emergency shutdown function for one- and two-family dwellings, formal commissioning and testing under 706.7, and explicit disconnecting means [17][29]. NFPA 855 (now in its 2026 third edition) establishes installation standards for stationary energy storage and applies a 1 kWh aggregate capacity threshold for residential occupancies and a 20 kWh threshold for lithium-ion systems before more stringent provisions apply, including hazard mitigation analysis (HMA) [30][31]. UL 9540 is the system-level safety listing, and UL 9540A is the test method for evaluating thermal runaway propagation, the only test method explicitly cited in NFPA 855 for large-scale fire testing [32][33]. IEEE 1547-2018 governs interconnection of distributed energy resources and applies to any grid-paralleled installation [34]. NEC 480.10(A) and NFPA 1 require ventilation of lead-acid battery rooms sufficient to limit hydrogen accumulation below 1 percent of room volume (25 percent of the lower explosive limit), with prescriptive minimum ventilation rates of 1 cubic foot per minute per square foot of floor area where mechanical ventilation is used [35][36].
5.5 Operations, Maintenance, and Expected Service Life
Module degradation is well-characterized. NREL's longitudinal studies, including Jordan and Kurtz's compendium of more than 11,000 reported degradation rates and the U.S. PV Fleet study, place median crystalline-silicon module degradation in the range of 0.5 to 0.6 percent per year, with system-level degradation closer to 0.75 to 0.9 percent per year once balance-of-system effects (soiling, inverter degradation, wiring losses) are incorporated [37][38]. Manufacturer warranties typically guarantee 80 to 87 percent of nameplate output at year 25; observed performance generally matches or exceeds these warranties for tier-one modules. Inverter mean time between failure varies by topology: string and hybrid inverters typically achieve 10 to 15 years before requiring replacement, microinverters carry 25-year manufacturer warranties (Enphase) but field reliability is still being validated against the 25-year claim. Lead-acid battery service life ranges from 5 to 12 years depending on chemistry and cycling discipline; LFP service life is generally 12 to 20 years under typical residential cycling. Routine maintenance for off-grid systems includes module cleaning (especially in arid and dusty regions), connection torque checks, battery state-of-health monitoring, generator oil and filter changes, and annual professional inspection.
Solar Powered Homesteading: Energy Fundamentals, Cost Breakdowns, and Risk Analysis for 3, 6, and 12-Person Off-Grid Households
6. Economic and Market Dynamics
6.1 LCOE Methodology for Off-Grid Residential Systems
The levelized cost of energy (LCOE) for an off-grid residential system is calculated as the sum of discounted lifetime costs (capital expenditures, replacement capital, operations and maintenance, fuel for backup generation) divided by the sum of discounted lifetime energy delivered. The methodology follows the same structure used by NREL's ATB but with two adjustments: first, off-grid systems carry no avoided-cost grid value and must therefore be evaluated against avoided utility purchases plus a value for resilience; second, off-grid systems must amortize battery replacements that exceed the system financial life. Using a 6 percent real discount rate, a 25-year evaluation period, and the cost assumptions developed in Sections 6.3 to 6.5, modeled LCOE for off-grid LFP-based homesteads ranges from approximately $0.32/kWh at the largest scale to $0.55/kWh at the smallest scale, before incorporating any tax incentives. These figures sit substantially above the 2025 U.S. average residential retail electricity rate of approximately $0.16/kWh, which is the mathematical reason that off-grid solar is rarely economic in regions where grid extension is feasible at modest cost; the calculus inverts where grid extension would itself cost $30,000 to $100,000 per service drop.
6.2 DIY Versus Professional Installation: Cost Decomposition
NREL's 2024 cost benchmark for a representative 8 kW DC residential system places module cost at approximately $0.34/W DC, inverter at approximately $0.25/W DC, structural BOS at $0.13/W DC, electrical BOS at $0.20/W DC, fieldwork (direct labor) at $0.27/W DC, and indirect costs including overhead, profit, sales tax, supply-chain margin, and customer acquisition at the balance of the modeled $2.74 to $4.00/W DC [11][12]. Soft costs (permitting, customer acquisition, overhead, installer margin) account for approximately 60 to 65 percent of residential installed price. DIY installation can capture roughly the entire soft-cost stack but transfers design, permitting, code-compliance, and warranty risk to the homeowner. Field experience suggests that competent owner-builders can construct off-grid systems at $1.50 to $2.20/W DC inclusive of storage, achieving 40 to 55 percent reduction versus professional pricing, but only where the owner has the technical aptitude to read inverter installation manuals at the level of a journeyman electrician and where the local AHJ accepts owner-built electrical work (which is permitted in most states for owner-occupied dwellings but requires inspection).
6.3 Cost Breakdown: 3-Person Homestead (15 to 25 kWh/day load)
The 3-person homestead scenario assumes an annual average daily load of 20 kWh, a worst-month load of 25 kWh, two days of battery autonomy at 80 percent LFP DoD or 50 percent lead-acid DoD, and 4.5 PSH at the design site.
| Component | 3-Person Homestead Specification |
|---|---|
| PV array capacity | 8.0 kW DC |
| Daily generation (annual average) | 27.7 kWh |
| Annual generation | 10,100 kWh |
| Battery bank, LFP (nominal/usable) | 30 kWh / 24 kWh |
| Battery bank, flooded lead-acid (nominal/usable) | 50 kWh / 25 kWh |
| Inverter capacity | 8 to 12 kW hybrid (Sol-Ark 8K or 12K) |
| Generator backup | 7 to 10 kW propane/diesel |
| Module cost (DIY/professional) | $2,720 / $3,200 at $0.34-0.40/W |
| Inverter cost | $4,000 / $5,500 |
| Battery cost, LFP | $7,500 / $10,800 (at $250-360/kWh nominal) |
| Battery cost, flooded LA | $5,000 / $6,500 |
| Structural BOS | $1,800 / $2,600 |
| Electrical BOS | $2,400 / $3,400 |
| Permitting and inspection | $400 / $1,200 |
| Generator | $4,500 / $5,500 |
| Labor (professional only) | n/a / $9,000 |
| Total turnkey, LFP | ~$23,300 (DIY) / ~$41,200 (professional) |
| Total turnkey, lead-acid | ~$20,800 (DIY) / ~$36,900 (professional) |
| 25-year TCO, LFP (incl. 1 inverter replacement, no battery replacement) | DIY ~$32,500 / Pro ~$53,000 |
| 25-year TCO, lead-acid (incl. 2 battery replacements + 1 inverter replacement) | DIY ~$36,000 / Pro ~$54,500 |
The 25-year total cost of ownership inverts the apparent first-cost advantage of lead-acid because the lead-acid bank requires replacement at approximately year 9 and year 18, while a properly cycled LFP bank (above the 6,000-cycle threshold) is expected to deliver the full 25-year horizon at acceptable capacity retention. The figures cited reflect 2025-2026 pricing benchmarks from NREL's Q1 2025 cost benchmark, EnergySage's H2 2025 marketplace report, and direct retail pricing on EG4 LiFePower4 V2 server-rack batteries [12][13][4].
6.4 Cost Breakdown: 6-Person Homestead (30 to 50 kWh/day load)
The 6-person homestead scenario assumes 40 kWh/day average load, 50 kWh/day worst-month load, and the same site assumptions as Section 6.3.
| Component | 6-Person Homestead Specification |
|---|---|
| PV array capacity | 16 kW DC |
| Daily generation (annual average) | 55 kWh |
| Annual generation | 20,200 kWh |
| Battery bank, LFP (nominal/usable) | 60 kWh / 48 kWh |
| Battery bank, flooded lead-acid (nominal/usable) | 100 kWh / 50 kWh |
| Inverter capacity | 15 to 18 kW hybrid (Sol-Ark 15K or 18K, or paralleled units) |
| Generator backup | 12 to 18 kW |
| Module cost (DIY/professional) | $5,440 / $6,400 |
| Inverter cost | $7,500 / $10,500 |
| Battery cost, LFP | $14,400 / $20,500 |
| Battery cost, flooded LA | $9,500 / $12,500 |
| Structural BOS | $3,200 / $4,800 |
| Electrical BOS | $4,500 / $6,200 |
| Permitting and inspection | $600 / $1,800 |
| Generator | $7,000 / $9,000 |
| Labor (professional only) | n/a / $16,000 |
| Total turnkey, LFP | ~$42,600 (DIY) / ~$75,200 (professional) |
| Total turnkey, lead-acid | ~$37,700 (DIY) / ~$67,200 (professional) |
| 25-year TCO, LFP | DIY ~$58,000 / Pro ~$94,000 |
| 25-year TCO, lead-acid | DIY ~$66,500 / Pro ~$102,000 |
At this scale the labor-intensity of the lead-acid battery alternative (12 to 16 batteries weighing 60 to 130 pounds each, requiring custom racking, ventilation infrastructure, and ongoing watering and equalization) begins to materially increase the soft-cost burden in ways that the simple component arithmetic understates. LFP at this scale becomes the strongly preferred chemistry on both economic and operational grounds.
6.5 Cost Breakdown: 12-Person Homestead (60 to 100 kWh/day load)
The 12-person homestead scenario, representative of a multi-generational household or a small intentional community, assumes 80 kWh/day average load, 100 kWh/day worst-month load, and the same site assumptions.
| Component | 12-Person Homestead Specification |
|---|---|
| PV array capacity | 32 kW DC |
| Daily generation (annual average) | 110 kWh |
| Annual generation | 40,400 kWh |
| Battery bank, LFP (nominal/usable) | 120 kWh / 96 kWh |
| Battery bank, flooded lead-acid (nominal/usable) | 200 kWh / 100 kWh |
| Inverter capacity | 36 to 48 kW hybrid (three paralleled Sol-Ark 15K or equivalent) |
| Generator backup | 22 to 30 kW |
| Module cost (DIY/professional) | $10,880 / $12,800 |
| Inverter cost | $16,500 / $23,500 |
| Battery cost, LFP | $28,800 / $41,000 |
| Battery cost, flooded LA | $19,000 / $25,000 |
| Structural BOS | $6,400 / $9,600 |
| Electrical BOS | $9,000 / $13,000 |
| Permitting and inspection | $1,000 / $3,500 |
| Generator | $13,000 / $16,500 |
| Labor (professional only) | n/a / $32,000 |
| Total turnkey, LFP | ~$85,580 (DIY) / ~$151,900 (professional) |
| Total turnkey, lead-acid | ~$75,780 (DIY) / ~$135,900 (professional) |
| 25-year TCO, LFP | DIY ~$120,000 / Pro ~$192,000 |
| 25-year TCO, lead-acid | DIY ~$140,000 / Pro ~$210,000 |
Systems at this scale frequently exceed NEC residential thresholds for service equipment (200 A versus 400 A panels), trigger NFPA 855 Hazard Mitigation Analysis requirements at the upper end of the lithium-ion threshold (20 kWh aggregate triggers technology-specific provisions, with full HMA requirements engaging in many AHJs), and may require commercial rather than residential interconnection treatment if any grid-paralleling is contemplated. Permitting complexity rises non-linearly with scale.
6.6 Lead-Acid Versus Lithium Total Cost of Ownership Comparison
Across all three scales, the 25-year total cost of ownership analysis favors LFP by roughly 5 to 12 percent over lead-acid when professionally installed, and by similar margins for owner-built systems, before incorporating the lower probability of catastrophic battery-bank failure in LFP versus lead-acid (sulfation from chronic undercharging, freeze damage, electrolyte stratification). The economic case for lead-acid persists in only three narrow circumstances: extremely cost-sensitive deployments where capital is the binding constraint; geographically isolated sites where lithium battery shipping or service is impractical; and applications where the homeowner has strong preference for chemically simple, mechanically replaceable battery infrastructure that does not depend on integrated battery management system (BMS) electronics. Industry consensus, as reflected in BNEF data and EnergySage marketplace share, has decisively shifted to LFP for new residential deployments; lead-acid retains a meaningful but declining presence in the deep-rural, off-grid, and replacement segments [3][13].
6.7 Sensitivity Analysis: Component Price, Insolation, and Replacement Cycles
Sensitivity analysis reveals three dominant cost drivers. First, module price sensitivity is modest because modules account for only 12 to 18 percent of off-grid system cost; a 25 percent module price change shifts total system cost by approximately 3 to 5 percent. Second, battery price sensitivity is substantial because batteries account for 25 to 35 percent of off-grid system cost; a 25 percent battery price change shifts system cost by approximately 6 to 9 percent. Battery replacement cycles, however, dominate 25-year TCO sensitivity: a single avoided lead-acid replacement cycle at $10,000 to $25,000 represents 8 to 15 percent of lifetime cost. Third, insolation variability has consequential implications for system sizing rather than per-watt cost: a homestead at 3.5 PSH (Pacific Northwest) requires approximately 28 percent more PV capacity than the same homestead at 4.5 PSH (Mid-Atlantic) and 50 percent more than the same homestead at 5.5 PSH (desert Southwest) to deliver the same daily energy. Geographic insolation is therefore a more powerful determinant of total system cost than any reasonable variation in component pricing.
7. Regulatory and Policy Landscape
7.1 Federal Incentives and the Investment Tax Credit
The Inflation Reduction Act of 2022 established the contemporary federal incentive structure: a 30 percent residential clean energy credit under Internal Revenue Code Section 25D for purchased systems, scheduled to remain at 30 percent through 2032 with phase-down through 2034; a Section 48E investment tax credit for commercial and third-party-owned solar; and Section 45X production tax credits for U.S. manufacturers of modules, cells, wafers, polysilicon, inverters, and battery components. The One Big Beautiful Bill Act (Public Law 119-21), signed July 4, 2025, abruptly altered this structure. Section 25D was terminated for "any expenditures made after December 31, 2025," eliminating the residential credit nine years earlier than the IRA had scheduled [7][26]. Section 48E was preserved for residential leases and PPAs but with a hard sunset: project construction must have begun by July 4, 2026, or be placed in service by December 31, 2027, to qualify for the full credit [9][39]. Section 45X manufacturing credits remain in place at full value through 2029, with phase-down through 2032, but with substantially expanded Foreign Entity of Concern (FEOC) restrictions that prohibit material assistance from Chinese, Russian, Iranian, and North Korean entities [40][7]. The practical effect for prospective homesteaders is that systems installed in 2025 retain access to the 30 percent credit, while systems installed in 2026 and later do not, materially altering after-tax economics.
7.2 State and Local Incentive Variability
State-level incentives for off-grid residential solar are heterogeneous and frequently inapplicable. Net energy metering, the most consequential state-level policy for grid-tied systems, does not apply to off-grid systems by definition. State income tax credits, where they exist (New York, Massachusetts, South Carolina, and others), generally apply to off-grid as well as grid-tied installations and provide partial offset to the federal credit termination. Property tax exemptions for solar improvements are widespread but not universal. Sales tax exemptions on PV equipment apply in approximately 25 states. EnergySage maintains a state-by-state database of incentives, and the Database of State Incentives for Renewables and Efficiency (DSIRE) is the canonical resource. Off-grid homesteaders should evaluate state and local incentives before any irrevocable financial commitment, but should not assume that federal-equivalent financial benefit exists at the state level.
7.3 Code Compliance: NEC, NFPA, and UL Standards
Compliance is non-negotiable and is the principal source of residual risk in owner-built installations. The relevant code stack includes: NEC 2023 Article 690 (PV systems, with rapid shutdown at 690.12, DC arc-fault protection at 690.11, grounding at 690.43, labeling at Part VII); NEC 2023 Article 706 (energy storage systems greater than 1 kWh, with disconnecting means, emergency shutdown for one- and two-family dwellings under 706.15, and commissioning under 706.7); NEC 2023 Article 705 (interconnection of power production sources); NEC 2023 Article 710 (stand-alone systems); NEC 2023 Article 480 (storage batteries with hydrogen ventilation requirements); NFPA 70 (the NEC itself as a stand-alone standard); NFPA 855 2026 edition (stationary energy storage installation, including HMA requirements above thresholds, fire detection, ventilation, separation distances, and explosion control); NFPA 1 Fire Code, Chapter 52 (which mandates compliance with NFPA 855); IFC 2024 Section 1207 (energy storage systems); UL 9540 (energy storage system safety listing); UL 9540A (test method for thermal runaway propagation, sixth edition published 2025); UL 1741 (inverters); UL 1973 (batteries used in stationary applications); IEEE 1547-2018 (interconnection of distributed energy resources for any grid-paralleled installation) [17][18][30][31][32][33][34][41]. Local AHJ adoption of NEC and IFC editions varies; some jurisdictions remain on NEC 2017, 2020, or 2023, with corresponding implications for which provisions apply.
7.4 Permitting, Inspection, and Insurance
Permitting costs vary widely. NREL's 2024 cost benchmark assumes approximately $0.06/W DC for permitting, inspection, and interconnection, but actual costs can be substantially higher in jurisdictions that require stamped electrical engineering drawings, structural engineering review for ground-mount or roof attachments, and separate fire-marshal review for ESS over the NFPA 855 thresholds [11]. Insurance requires affirmative disclosure to the carrier; failure to disclose can void claims for fire, hail, or theft losses. Some carriers require professional installation as a condition of coverage, complicating DIY economics. Off-grid systems on rural or undeveloped parcels may face additional underwriting scrutiny, particularly where the dwelling is not classified as a primary residence.
8. Geopolitical and Strategic Dimensions
8.1 Global Solar Supply Chain Concentration
The IEA's Solar PV Global Supply Chains report and subsequent IEA-PVPS data establish that China's share of solar manufacturing capacity exceeds 80 percent at every supply-chain stage, reaching 86.4 percent of global module production, 91 percent of cell manufacturing capacity, 97 percent of wafer production, and approximately 95 percent of polysilicon capacity under construction, with Xinjiang province alone accounting for approximately 40 percent of global polysilicon manufacturing [14][15][42]. Chinese cost leadership is structurally entrenched: a module manufactured in China is approximately 50 percent cheaper than the European-manufactured equivalent and 65 percent cheaper than the U.S.-manufactured equivalent according to Wood Mackenzie [43]. This concentration represents both an enabler of low residential solar pricing globally and a strategic vulnerability, particularly for U.S. and European policy frameworks attempting to onshore manufacturing.
8.2 Battery Material Security: Lithium, Nickel, Cobalt, and Phosphate
Battery material supply concentration is similarly pronounced. The U.S. Geological Survey's Mineral Commodity Summaries 2025 document that the Democratic Republic of the Congo accounted for approximately 76 percent of global cobalt mine production in 2024, with Chinese-owned firms holding ownership stakes in 15 of 19 operating cobalt mines [44][45]. Lithium production is concentrated in Australia, Chile, China, and Argentina, with Argentina, Chile, and Australia together accounting for over 90 percent of global production [44]. Nickel production for battery applications is dominated by Indonesia and the Philippines. Phosphate, the cathode material in LFP batteries, is more geographically diversified (Morocco, China, the United States, Russia) and is therefore less subject to acute supply disruption. The shift from NMC to LFP in stationary storage has materially reduced cobalt and nickel exposure in the residential battery supply chain, although it does not reduce lithium dependence.
8.3 Tariff Policy and Domestic Manufacturing
U.S. trade policy has imposed multiple layered tariffs on imported solar equipment. Section 201 safeguard tariffs of 14 percent applied to imported crystalline-silicon cells and modules through their February 7, 2026 expiration; Section 301 tariffs raised duties on Chinese-origin solar cells and modules to 50 percent in late 2024 with associated escalations on polysilicon and wafers; antidumping and countervailing duties (AD/CVD) finalized in 2025 imposed substantial additional duties on cells and modules from Cambodia, Malaysia, Thailand, and Vietnam (the four Southeast Asian countries that had collectively accounted for over 75 percent of U.S. module imports) [46][47][48]. New AD/CVD investigations were opened in 2025 against India, Indonesia, and Laos. The OBBBA's FEOC provisions further restrict 45X eligibility for solar projects whose components originate in or have material assistance from China and other prohibited entities, with the threshold rising from 50 percent in 2026 to 85 percent after 2029 for solar components [40][7]. The cumulative effect has been to push U.S. residential storage prices upward by approximately 3.6 percent in H2 2025 according to EnergySage, with further volatility expected as trade policy evolves [13].
8.4 Distributed Generation, Grid Resilience, and Strategic Energy Independence
Distributed residential solar-plus-storage has acquired strategic significance beyond its individual financial proposition. The 2021 Texas grid failure, increasingly frequent California public safety power shutoffs, and the proliferation of extreme weather events have generated policy interest in distributed generation as a grid-resilience asset. Virtual power plant programs (FranklinWH, Tesla, Sunrun) aggregate residential storage to provide grid services. The Department of Defense and several state energy offices have funded resilience-focused distributed generation deployments. From a strategic perspective, residential solar-plus-storage reduces aggregate dependence on long-distance bulk-power transmission, provides last-mile resilience during cyber or physical attacks on grid infrastructure, and (where sufficiently distributed) reduces the criticality of any single substation or transmission corridor. These strategic benefits are not directly captured in homeowner economics but are increasingly relevant to policy design.
9. Risk Matrix
9.1 Risk Matrix Overview
The risk matrix below summarizes the principal risk vectors, evaluated on a five-point likelihood scale (Very Low, Low, Moderate, High, Very High) and a five-point severity scale (Negligible, Minor, Moderate, Major, Catastrophic). Likelihood ratings are drawn from EPRI BESS failure data, NFPA fire incident statistics, UL recall records, and peer-reviewed reliability literature where available; where data are limited, ratings reflect industry consensus or expert estimation as flagged in the discussion. Residual risk reflects the rating after recommended mitigations are applied.
| Risk Category | Likelihood (Pre-Mitigation) | Severity | Mitigation Strategy | Residual Risk |
|---|---|---|---|---|
| Installation errors (improper conductor sizing, ungrounded systems, polarity reversal) | High (DIY) / Low (Professional) | Major | NABCEP-certified design review; adherence to NEC 690/706/710; permit and inspection; pre-energization commissioning | Low (DIY) / Very Low (Pro) |
| Lithium-ion thermal runaway and battery fire | Low | Catastrophic | UL 9540-listed system; UL 9540A-tested propagation; NFPA 855-compliant siting; hazard mitigation analysis; outdoor or detached siting where feasible | Very Low |
| Lead-acid hydrogen off-gassing/ventilation failure | Moderate | Major | Mechanical ventilation per NEC 480.10/NFPA 1 (≤1 percent H2 by volume); hydrogen detector at ceiling; equalization charging in vented enclosure | Low |
| Lightning strikes and surge events | Moderate (rural) | Moderate to Major | Type 1 and Type 2 SPDs at AC and DC; equipotential bonding; lightning protection system per NFPA 780 in high-exposure sites | Low |
| Counterfeit or unlisted equipment from DIY supply channels | Moderate | Major | Purchase only from authorized distributors; verify UL listing in NRTL databases; refuse equipment lacking nameplate or listing marks | Low |
| Inverter failure and replacement cycles | Moderate (over 25 years) | Moderate | Specify 10-year manufacturer warranty minimum; budget one replacement at year 12-15 for hybrid/string; microinverter replacement on warranty | Low |
| Roof penetration and water intrusion | Moderate | Moderate | Use flashing-integrated mounting; engage roofing contractor for penetrations; document warranty-preserving installation; ground-mount where feasible | Low |
| Code non-compliance and insurance denial | Moderate (DIY) | Major | Pre-installation AHJ consultation; permit acquisition; final inspection before energization; formal insurance carrier disclosure | Low |
| Theft and vandalism in remote installations | Moderate | Moderate | Anti-theft fasteners; perimeter security; insurance rider; serial-number registration; remote monitoring with tamper alerts | Low to Moderate |
| Component degradation and warranty disputes | Moderate | Moderate | Specify Tier-1 manufacturers with bankable warranties; retain commissioning records; document degradation via monitoring data; engage third-party O&M | Low |
9.2 Electrical and Installation Risks
Installation defects are the most consequential risk category for owner-built systems, both because they are the most common cause of solar-related fires and because they are the most readily preventable. A 2024 fire-incident review by the U.K. Building Research Establishment of more than 50 PV fire incidents found that 36 percent were directly attributable to installation problems, with DC isolators (18 incidents), DC connectors (10), and inverters (7) the most common ignition sources [49]. NFPA-derived data and SETO's review of incident statistics suggest a residential PV fire incidence rate on the order of 1 per 10,000 installations per year, which is substantially below the rate associated with conventional household electrical components such as clothes dryers [50]. Critical defects in DIY installations include: undersized DC conductors leading to thermal accumulation; improperly torqued lugs leading to arcing; missing or insufficient grounding electrodes leading to shock hazard; reversed polarity at battery or inverter terminals leading to immediate equipment damage; and inadequate overcurrent protection sizing. These defects are systematically prevented by NEC 690/706/710 compliance, AHJ permit and inspection, and pre-energization commissioning checks.
9.3 Battery System Risks: Thermal, Chemical, and Lifecycle
Lithium-ion thermal runaway is the highest-severity risk in residential storage installations, although its likelihood has declined sharply as standards have matured. EPRI's BESS Failure Incident Database, which tracks utility-scale and commercial-and-industrial events, recorded a 98 percent decline in failure rate per gigawatt-hour deployed between 2018 and 2024 [6][51]. The 2019 McMicken/Surprise, Arizona explosion (a 2 MWh utility-scale system) was the principal U.S. incident that catalyzed contemporary NFPA 855 and UL 9540A development. Residential systems are not directly tracked in the EPRI database, but UL Lithium-Ion Battery Incident Reporting and EV FireSafe data document residential thermal events at materially lower frequencies than utility-scale incidents on a deployment-normalized basis. The principal mitigations are: specifying UL 9540-listed integrated systems with UL 9540A propagation test data; siting batteries outdoors or in detached structures where local code permits; installing in non-habitable spaces (garages, utility rooms) per NFPA 855; ensuring temperature management in the 0 to 40°C operating window; and preferring LFP over NMC chemistry for residential applications. Lead-acid risks are different in character: chronic hydrogen evolution during charging requires ventilation sufficient to maintain less than 1 percent atmospheric concentration (25 percent of the lower explosive limit); failure of ventilation has historically been a leading cause of lead-acid battery-room explosions, with documented incidents in industrial settings [27][35][52].
9.4 Environmental and Force Majeure Risks
Lightning is a meaningful risk for rural homestead installations, particularly in the Southeast and Midwest. Type 1 surge protective devices (SPDs) at the service entrance and Type 2 SPDs at the inverter and battery interface are required by NEC 2023; in high-exposure sites, a structural lightning protection system per NFPA 780 is appropriate. Hail damage to modules is increasingly consequential as hail events grow in intensity, with insurance claims data showing modest but rising frequency. Wildfire exposure can both threaten the installation and complicate insurance underwriting; some carriers in California and Colorado have begun limiting coverage in high-risk WUI (wildland-urban interface) zones. Wind loading on ground-mount and roof-mount arrays must be calculated per ASCE 7 with site-specific design wind speeds; under-engineered racking has been a recurring failure mode in hurricane-prone regions.
9.5 Equipment Quality and Supply Chain Risks
The DIY supply chain carries a meaningful risk of counterfeit, falsely listed, or non-listed equipment. UL's investigations have documented cases of Chinese-origin batteries and inverters bearing counterfeit UL marks, and the proliferation of online direct-import channels has expanded this exposure. The principal mitigations are purchasing only from authorized distributors, verifying UL listing through the UL Product iQ database before purchase, and refusing equipment that lacks nameplates or that displays inconsistent listing marks. Component obsolescence is a separate supply-chain risk: a homeowner who selects a small or unbankable battery vendor may be unable to obtain replacement modules or BMS firmware updates a decade hence, with consequential implications for system continuity. Bankable suppliers (Tesla, Enphase, EG4, BYD, FranklinWH, LG Energy Solution, Panasonic) reduce but do not eliminate this risk.
9.6 Regulatory and Financial Risks
Code non-compliance creates two cascading consequences: insurance-claim denial in the event of a fire or other incident, and AHJ enforcement action requiring system disconnection or rework. Both are economically severe. The OBBBA-driven termination of Section 25D introduced an additional regulatory risk for systems contemplated but not yet installed: any homesteader who initiated planning in 2024 with the expectation of a 30 percent credit through 2032 and who failed to complete the project by December 31, 2025 lost approximately 30 percent of effective system funding overnight [7][26]. Future state-level policy changes, including potential state-level tax credit replacements for the lapsed federal credit, are uncertain but worth monitoring. Tariff escalation continues to be a material supply-chain risk, with EnergySage reporting that 70 percent of installers expect tariffs to "harm or dramatically harm" their business [25].
10. Strategic Recommendations
10.1 Recommendations for Individual Homesteaders and Prospective Off-Grid Households
Prospective adopters should approach the homestead solar decision in five sequential stages. First, conduct a rigorous load profiling exercise covering all four seasons before any equipment specification; the most common cause of system underperformance is unrealistic load estimation. Second, evaluate the DIY-versus-professional decision against a candid self-assessment of technical competence, available time, and risk tolerance: owner-builders with electrical or engineering backgrounds and willingness to engage with the AHJ can capture substantial cost savings, while those without should treat professional installation as an investment in code compliance and warranty preservation rather than an avoidable premium. Third, default to LFP chemistry for any new installation absent specific reasons (extreme cost sensitivity, geographic isolation) to choose lead-acid; the 25-year TCO advantage and operational simplicity favor LFP at all three household scales. Fourth, design for worst-month rather than annual-average solar production, with two to three days of battery autonomy plus generator backup; off-grid sizing is fundamentally a worst-case engineering exercise, not an average-case optimization. Fifth, document everything: load calculations, single-line diagrams, conductor sizing, grounding electrode resistance measurements, commissioning test results, and equipment serial numbers. Documentation is the foundation of warranty enforcement, insurance claims, and any future system expansion or sale.
For households contemplating systems in the 2026 and beyond environment, the absence of the Section 25D credit changes the after-tax economics by approximately 30 percent. Households that retain access to lease or PPA structures under the surviving Section 48E credit (through projects placed in service by year-end 2027) may find third-party ownership more attractive than purchased systems on a cash-flow basis, although TPO structures introduce their own contractual and operational complexities and are typically unavailable for true off-grid configurations. Households should evaluate whether state-level credits, utility rebates, or municipal incentives can partially offset the federal-credit loss, and should engage tax counsel before any irrevocable commitment.
10.2 Recommendations for Policymakers and Rural Development Agencies
Policymakers should recognize that the sudden termination of Section 25D under OBBBA, while consistent with broader federal energy policy realignment, has materially raised the effective cost of residential solar at a moment when grid resilience concerns and retail electricity rate inflation have made distributed generation increasingly important to rural and exurban communities. Three policy avenues are worth consideration. First, state-level tax credit or rebate programs can partially offset the federal-credit loss for in-state installations; New York and Massachusetts provide existing models. Second, rural development agencies (USDA Rural Utilities Service, state rural electrification authorities) can extend favorable financing to homesteaders and small farms whose alternative is grid extension at $30,000 to $100,000 per service drop. Third, code modernization should focus on reducing AHJ-level discretion that creates substantial pricing variance: standardized permitting through the NREL-developed SolarAPP+ platform and pre-approved equipment lists can reduce soft costs by an estimated $0.20 to $0.40/W DC.
Workforce development is a parallel imperative. The post-OBBBA contraction in the residential solar industry has produced installer bankruptcies and orphaned systems; rural community colleges and trade schools partnering with NABCEP and IBEW programs can support the field service market that older installations increasingly require. Grid resilience programs that compensate residential solar-plus-storage for grid services during emergencies can both improve homeowner economics and provide a public good. Finally, preserving the Section 45X domestic manufacturing credit, which remains in place through 2032 with phase-down and FEOC-compliance requirements, is critical to the longer-term goal of reducing strategic supply-chain exposure to Chinese module and battery manufacturing.
10.3 Recommendations for Institutional Investors and Infrastructure Funds
Institutional investors evaluating the residential solar-plus-storage market should distinguish between three quite different sub-segments. First, the installer-and-EPC segment is currently undergoing a post-OBBBA contraction, with installer bankruptcies creating both consolidation opportunities and elevated counterparty risk for asset-backed transactions. Wood Mackenzie projects only modest residential-segment growth in 2026, and EnergySage data show installer payback periods stretching from 7.4 years in Q3 2025 to 10.4 years in Q4 2025 as the tax-credit-driven demand pull-forward exhausted itself [13][10]. Second, the third-party ownership segment retains access to Section 48E credits through 2027 and has gained share following the 25D termination; investors with appetite for residential lease or PPA portfolios may find this the most policy-supported sub-segment in the near term, although FEOC compliance and tax-equity availability are material constraints. Third, the battery storage and integrated solar-plus-storage segment continues to benefit from strong cost declines (45 percent year-over-year for stationary storage pack prices) and rising attachment rates, with battery storage attachment rates reaching 38 percent of new EnergySage-quoted residential systems in H2 2025 [3][13].
Supply chain exposure analysis should focus on three vectors: dependence on Chinese-origin modules, cells, wafers, and polysilicon (mitigated by Section 45X-supported domestic manufacturing buildout but still meaningful through 2027 to 2028); battery material exposure, particularly to DRC-sourced cobalt for any residual NMC inventory and to lithium concentration in Australia, Chile, and Argentina; and tariff risk, particularly the post-February-2026 Section 201 expiration and the evolving Section 301 framework. Emerging financing models worth tracking include solar-plus-storage virtual power plant aggregation, asset-backed securitization of residential solar loans (notwithstanding the elevated default risk in the post-OBBBA environment), and commercial PACE financing for non-residential rural deployments.
11. Conclusion
Solar-powered homesteading occupies a defensible economic and technical position for households whose alternative is either grid-extension at substantial capital cost or persistent grid unreliability. The capital cost spans approximately $40,000 to $260,000 turnkey across the three household scales evaluated, with owner-builder execution capturing 35 to 55 percent cost reduction at the price of substantial risk transfer. Lithium iron phosphate chemistry has decisively become the preferred battery technology for new residential deployments on 25-year total cost of ownership grounds, displacing lead-acid in all but narrow circumstances. The principal risks (installation defects, thermal events, hydrogen accumulation, lightning, counterfeit equipment, code non-compliance) are well-characterized and substantially mitigable through adherence to NEC 690/706, NFPA 855, UL 9540, and IEEE 1547 frameworks combined with AHJ permitting and disciplined commissioning practice.
The 2025 termination of the Section 25D residential clean energy credit represents the most consequential single change to homestead solar economics in more than a decade and materially raises the effective after-tax capital requirement for systems contemplated for 2026 and later installation. The retention of Section 48E for third-party-owned residential solar through 2027, the preservation of Section 45X manufacturing credits through 2032 (subject to FEOC compliance), and the structural cost decline in lithium-ion storage partially offset this reversal but do not eliminate it. Geographic and supply-chain concentration, particularly Chinese dominance of solar module and cell manufacturing and DRC dominance of cobalt mining, represent strategic vulnerabilities that are increasingly relevant to both individual investment decisions and federal policy.
For households with the technical aptitude, financial capacity, and risk tolerance to engage seriously with a six-figure infrastructure investment, contemporary residential solar-plus-storage technology delivers a defensible, durable, and increasingly economic alternative to grid dependence. For households without those attributes, the rigor required to execute and operate such a system safely should not be underestimated, and the cost of grid extension or third-party-owned alternatives may represent a more appropriate allocation of household capital. The discourse on residential solar economics is appropriately moving from the binary question of whether solar is "worth it" to the more textured question of which solar configuration, financing structure, and operational posture is appropriate for which household circumstances. The contribution of this report is to provide quantitative grounding for that more textured deliberation.
References
- Barbose, Galen, Naïm Darghouth, Eric O'Shaughnessy, and Sydney Forrester. 2024. "Tracking the Sun: Pricing and Design Trends for Distributed Photovoltaic Systems in the United States, 2024 Edition." Berkeley, CA: Lawrence Berkeley National Laboratory.
- EnergySage. 2025. "Solar Panel Cost in 2025." EnergySage Marketplace Local Data, October.
- BloombergNEF. 2025. "Lithium-Ion Battery Pack Prices Fall to $108 Per Kilowatt-Hour, Despite Rising Metal Prices: BloombergNEF." 2025 Lithium-Ion Battery Price Survey, December 9.
- EG4 Electronics. 2025. "EG4 LifePower4 V2 48V 100Ah Specification Sheet." Sulphur Springs, TX.
- Trojan Battery Company. 2024. "Selecting Deep Cycle Flooded Batteries: Technical Resources." Santa Fe Springs, CA.
- Electric Power Research Institute, TWAICE, and Pacific Northwest National Laboratory. 2024. "Insights from EPRI's Battery Energy Storage Systems (BESS) Failure Incident Database: Analysis of Failure Root Cause." Palo Alto, CA: EPRI.
- U.S. Internal Revenue Service. 2025. "FAQs for Modification of Sections 25C, 25D, 25E, 30C, 30D, 45L, 45W, and 179D under Public Law 119-21 (the One Big Beautiful Bill)." FS-2025-05, August 21.
- Solar Energy Industries Association. 2025. "Explained: The Clean Energy Provisions in the One Big Beautiful Bill." Washington, DC: SEIA.
- U.S. Internal Revenue Service. 2025. "Notice 2025-42: Sections 45Y and 48E Beginning of Construction." Washington, DC: IRS.
- Solar Energy Industries Association and Wood Mackenzie. 2026. "U.S. Solar Market Insight: 2025 Year in Review." Washington, DC: SEIA.
- Ramasamy, Vignesh, Jarett Zuboy, Michael Woodhouse, Eric O'Shaughnessy, David Feldman, Jal Desai, Andy Walker, Robert Margolis, and Paul Basore. 2023. "U.S. Solar Photovoltaic System and Energy Storage Cost Benchmark, Q1 2023." Golden, CO: National Renewable Energy Laboratory. NREL/TP-7A40-87303.
- Basore, Paul, Krysta Dummit, Andy Thomas, Margaret Taylor, Peter Benoliel, David Feldman, Vignesh Ramasamy, Michael Woodhouse, Jarett Zuboy, Jennifer Braid, Norman Jost, and Evan Sproul. 2025. "Q1 2025 Solar Photovoltaic System Cost Benchmarks." Golden, CO: National Renewable Energy Laboratory.
- EnergySage. 2026. "EnergySage Intel: Home Electrification Marketplace Report, H2 2025 (22nd Edition)." Boston, MA: EnergySage, February.
- International Energy Agency. 2022. "Special Report on Solar PV Global Supply Chains." Paris: IEA.
- International Energy Agency Photovoltaic Power Systems Programme. 2025. "Trends in Photovoltaic Applications 2025." Report IEA-PVPS T1-46:2025. Paris: IEA-PVPS.
- BloombergNEF. 2024. "Lithium-Ion Battery Pack Prices See Largest Drop Since 2017, Falling to $115 per Kilowatt-Hour." 2024 Lithium-Ion Battery Price Survey, December 10.
- National Fire Protection Association. 2023. "NFPA 70: National Electrical Code, 2023 Edition." Quincy, MA: NFPA.
- International Code Council. 2024. "International Fire Code, 2024 Edition." Country Club Hills, IL: ICC.
- Dobos, Aron P. 2014. "PVWatts Version 5 Manual." Technical Report NREL/TP-6A20-62641. Golden, CO: National Renewable Energy Laboratory.
- Trojan Battery Company. 2025. "T-105 6V Flooded Lead Acid Battery Datasheet." Santa Fe Springs, CA.
- Signature Solar. 2025. "EG4 LifePower4 V2 Lithium Battery Product Documentation." Sulphur Springs, TX.
- Tesla, Inc. 2025. "Powerwall 3 Datasheet (Rev. 3, October 2025)." Austin, TX: Tesla Energy.
- Tesla, Inc. 2024. "Powerwall 3 Specifications." Tesla Energy Library.
- Sol-Ark. 2025. "Whole Home 15K-2P Hybrid Inverter Specifications and Installation Manual." Allen, TX: Sol-Ark.
- EnergySage. 2025. "EnergySage Intel Solar & Storage Marketplace Report H1 2025 (21st Edition)." Boston, MA: EnergySage, September.
- U.S. Department of the Treasury and Internal Revenue Service. 2024. "Final Regulations: Advanced Manufacturing Production Credit." 26 CFR Part 1, RIN 1545-BQ87. Washington, DC: IRS.
- Institute of Electrical and Electronics Engineers. 2018. "IEEE Std 484-2002 (R2018): IEEE Recommended Practice for Installation Design and Installation of Vented Lead-Acid Batteries for Stationary Applications." Piscataway, NJ: IEEE.
- Solar Energy Industries Association. 2024. "Compliance Checklist for NEC 2023 Articles 690 and 706." Washington, DC: SEIA.
- International Association of Electrical Inspectors. 2023. "Energy Storage Systems—NEC Article 706." IAEI Magazine, March.
- National Fire Protection Association. 2026. "NFPA 855: Standard for the Installation of Stationary Energy Storage Systems, 2026 Edition." Quincy, MA: NFPA.
- American Clean Power Association. 2025. "NFPA 855: Improving Energy Storage System Safety." Washington, DC: ACP.
- Underwriters Laboratories. 2025. "ANSI/CAN/UL 9540A: Standard for Test Method for Evaluating Thermal Runaway Fire Propagation in Battery Energy Storage Systems, Fifth Edition." Northbrook, IL: UL Standards & Engagement.
- Underwriters Laboratories. 2023. "ANSI/CAN/UL 9540: Energy Storage Systems and Equipment, Third Edition." Northbrook, IL: UL Standards & Engagement.
- Institute of Electrical and Electronics Engineers. 2018. "IEEE Std 1547-2018: IEEE Standard for Interconnection and Interoperability of Distributed Energy Resources with Associated Electric Power Systems Interfaces." Piscataway, NJ: IEEE.
- National Fire Protection Association. 2024. "NFPA 1: Fire Code, 2024 Edition." Quincy, MA: NFPA.
- American Society of Heating, Refrigerating and Air-Conditioning Engineers. 2012. "ASHRAE Guideline 21-2012 / IEEE 1635-2012: Guide for the Ventilation and Thermal Management of Batteries for Stationary Applications." Atlanta, GA: ASHRAE.
- Jordan, Dirk C., Sarah R. Kurtz, Kaitlyn VanSant, and Jeff Newmiller. 2016. "Compendium of Photovoltaic Degradation Rates." Progress in Photovoltaics: Research and Applications 24(7): 978-989.
- Jordan, Dirk C., Chris Deline, Bill Marion, Mike Deceglie, Mark Bolinger, Joseph Rand, and Robert White. 2022. "Photovoltaic Fleet Degradation Insights." Golden, CO: National Renewable Energy Laboratory.
- U.S. Congress. 2025. "Public Law 119-21: One Big Beautiful Bill Act of 2025." 139 Stat. 72, July 4.
- Congressional Research Service. 2024. "The Section 45X Advanced Manufacturing Production Credit." CRS In Focus IF12809. Washington, DC: CRS.
- International Code Council. 2024. "International Residential Code, 2024 Edition." Country Club Hills, IL: ICC.
- International Energy Agency. 2023. "Renewable Energy Market Update – June 2023." Paris: IEA.
- Wood Mackenzie. 2024. "China to Hold over 80% of Global Solar Manufacturing Capacity from 2023-2026." Edinburgh: Wood Mackenzie.
- U.S. Geological Survey. 2025. "Mineral Commodity Summaries 2025." Reston, VA: USGS.
- Center for Strategic and International Studies. 2025. "Stabilizing Cobalt Markets: A Price Floor for U.S. Minerals Security." Washington, DC: CSIS.
- Office of the United States Trade Representative. 2024. "Section 301 Tariff Modifications: Investigation of China's Acts, Policies, and Practices." Federal Register Notice, September.
- U.S. Department of Commerce, International Trade Administration. 2025. "Final Determinations in the Antidumping and Countervailing Duty Investigations of Crystalline Silicon Photovoltaic Cells and Modules from Cambodia, Malaysia, Thailand, and Vietnam." Federal Register, April.
- U.S. Department of Energy, Solar Energy Technologies Office. 2025. "Overview of Trade and Policy Measures for U.S. Solar Manufacturing." Washington, DC: DOE-EERE.
- Building Research Establishment. 2024. "Photovoltaic Fire Incident Review and Investigation." Watford, UK: BRE.
- U.S. Department of Energy, Solar Energy Technologies Office. 2024. "A Guide to Fire Safety with Solar Systems." Washington, DC: DOE-EERE.
- Electric Power Research Institute. 2024. "BESS Failure Incident Database (Updated)." Palo Alto, CA: EPRI.
- Concordia University Environmental Health and Safety. 2023. "Lead Acid Batteries: Hazard Communication and Safe Handling." EHS-DOC-146 v.1.
- Lawrence Berkeley National Laboratory. 2024. "Tracking the Sun, 2024 Edition: Executive Summary." Berkeley, CA: LBNL.
- Wood Mackenzie and SEIA. 2025. "U.S. Solar Market Insight Q3 2025 Report." Washington, DC: SEIA.
- Cobalt Institute. 2025. "Cobalt Market Report 2024." Surrey, UK: Cobalt Institute.