Wind Turbine Lifecycle Emissions and Carbon Payback: Why 11 g CO2-eq/kWh Depends on Capacity Factor, Allocation, and the Displaced Grid
Utility-scale wind converges near 11 g CO2-eq/kWh, but capacity factor, allocation convention, and the displaced grid decide the carbon payback.

Lifecycle Carbon Accounting and Carbon Payback of Utility-Scale Wind Turbines: Quantifying Embodied Emissions and Net CO₂ Avoidance
TL;DR
- The cradle-to-grave greenhouse gas burden of a modern utility-scale wind turbine converges near 11 g CO₂-eq/kWh (harmonized range ~3 to 45 g/kWh, central 6 to 20 g/kWh once capacity factor and boundary are aligned), one to two orders of magnitude below unabated fossil generation and comparable to nuclear and hydro [1][3][4].
- The result is governed less by the physical bill of materials than by four assumptions: capacity factor, design life, end-of-life allocation convention, and the emission factor of the displaced grid. Steel and iron dominate mass (~80 to 90 percent) and roughly half of embodied emissions [9][12].
- Carbon payback is a joint property of turbine and grid, not a fixed technology attribute: months against a coal grid, ~1 year against gas, and it diverges toward infinity as the displaced grid decarbonizes. Energy payback is 5 to 14 months with an EROI near or above 20:1 [3][5][6][31].
Key Findings
The strongest evidence base is mutually consistent. The NREL harmonization, IPCC AR5 Annex III, and UNECE all place onshore wind near 11 g CO₂-eq/kWh and offshore near 12 g/kWh once capacity factor and system boundary are normalized [1][3][4]. Manufacturer-verified EPDs corroborate this: Vestas reports 6.2 g CO₂-eq/kWh net for its onshore EnVentus V162-6.2 MW (low-wind IEC S class, 20-year life) and 7.0 g/kWh net for its offshore V236-15.0 MW (high-wind class, 30-year life), both critically reviewed to ISO 14040/14044/TS 14071 [5][6].
The per-kWh figure is dominated by the denominator (lifetime net generation) and the counterfactual (displaced grid), not by inventory precision. A per-kWh figure computed at a 48 percent capacity factor is not comparable to one at 30 percent even with identical physical inventories. Steel route, end-of-life allocation, and degradation rate are the next-largest levers. Peatland siting is a site-specific term that can, under adverse conditions, consume the majority of a project's lifetime carbon savings [7][8].
Details
1. Methodological frame
The analysis is governed by ISO 14040 and ISO 14044, ISO 14067 for product carbon footprint, the GHG Protocol Product Life Cycle Accounting and Reporting Standard, and EN 15804 for EPDs. The IEC 61400 series fixes design class, design life, and power performance; the wind-class assignment under IEC 61400 determines the capacity factor an EPD uses, which is why it drives headline numbers. This report uses attributional accounting for the physical inventory and consequential accounting for break-even, because the counterfactual grid is a consequential question an attributional inventory cannot answer.
The functional unit is one kWh of net electricity delivered to the point of interconnection over plant life. The reference flow is the complete plant (turbine, foundation, site cabling, transformer/substation). The boundary is cradle-to-grave. The metric is GWP-100, with attention to whether AR5 or AR6 characterization factors were used, since these differ for methane and other species [3]. Capital goods are included in the better manufacturer inventories but often truncated in academic process LCAs, a bias that hybrid input-output methods partly correct [1].
End-of-life allocation is the most consequential methodological choice after capacity factor. Under the cut-off convention no recycling credit accrues; under the avoided-burden (closed-loop) convention the asset is credited for displacing primary metal. Vestas applies avoided-burden: the onshore V162's gross manufacturing figure of 9.1 g CO₂-eq/kWh falls to 6.2 g/kWh net after a −3.2 g/kWh (−34 percent) end-of-life recycling credit [5]. This single convention moves the headline by about 34 percent, exceeding most physical inventory uncertainties. The NREL harmonization deliberately used consistent gross boundaries to strip out this variance [1].
2. Materials inventory and embodied emissions
Structural mass is overwhelmingly steel, iron, and concrete. The European Commission Joint Research Centre gives central intensities of 110 ± 20 t/MW of steel, 400,000 ± 100,000 kg/MW of foundation concrete, 19,000 ± 3,000 kg/MW of cast iron, copper of 650 to 6,200 kg/MW depending on drivetrain, aluminium of 150 to 1,900 kg/MW, glass/carbon composites of 6,000 to 9,000 kg/MW, and polymers of 4,700 ± 800 kg/MW [9]. A study of the global fleet 1991 to 2017 found concrete and steel averaged 75.1 percent and 22.8 percent of onshore turbine mass respectively, while rare earths were only 0.03% (onshore) and 0.01% (offshore) by weight [10]. Copper intensity is architecture-driven: the JRC reports up to 5,700 ± 500 kg/MW for direct-drive electrically-excited synchronous machines versus roughly 850 to 900 kg/MW for geared configurations [9].
The historical trend in mass per MW has been roughly flat. A DTU analysis of the Vestas platform series found per-kWh emissions "almost constant" from the V90 to the V162 because larger rotors raise material use and energy capture proportionately [11]. In the offshore V236-15.0 MW, steel and iron are 82.9 percent of turbine mass; at plant level with cabling, steel and iron are 78.4 percent and copper 7.2 percent [6].
3. Steel
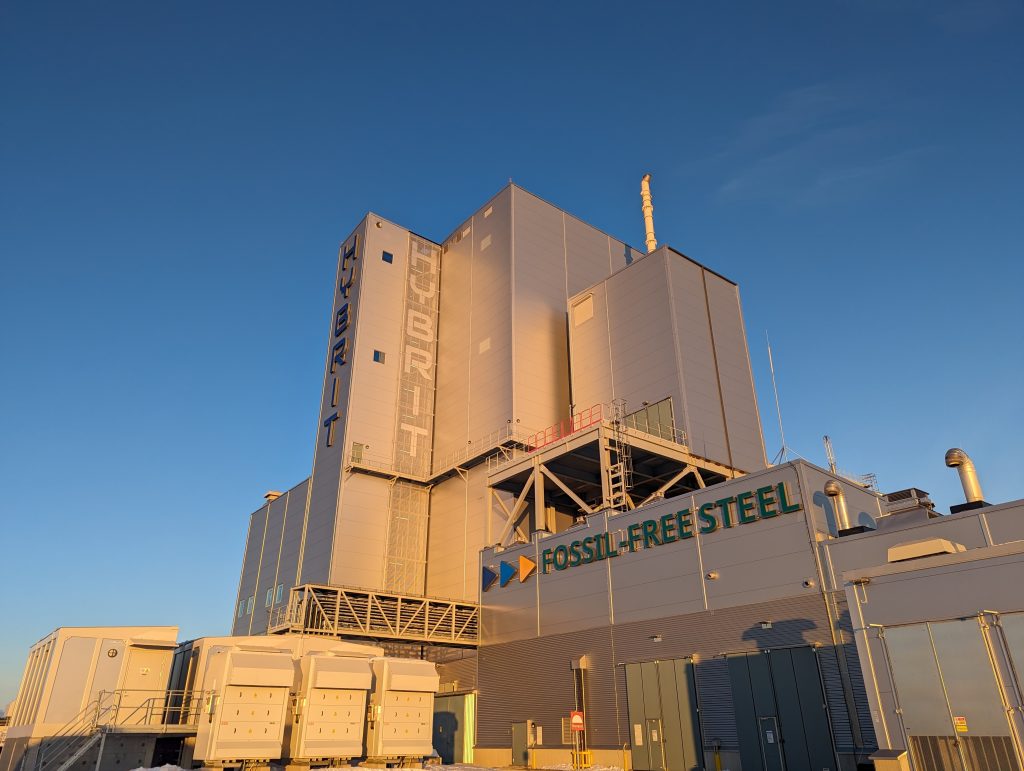
Steelmaking route dominates the embodied-carbon variance of the largest material stream. The blast-furnace/basic-oxygen-furnace (BF-BOF) primary route emits roughly 1.9 to 2.3 t CO₂ per tonne of crude steel; the ~2.3 t CO₂/t figure is the BF-BOF route specifically, whereas the World Steel Association's production-weighted global all-route average for 2023 was about 1.92 t CO₂ per tonne of crude steel cast [12][13]. The scrap-based electric-arc-furnace (EAF) route has potential to emits far less, on the order of 0.4 t CO₂/t where scrap-fed and grid-decarbonized. The global-average scrap-EAF figure is near 1.43 t CO₂/t, because most EAF capacity runs on carbon-intensive grids [12]. Hydrogen direct-reduced iron (H2-DRI) with EAF, as pursued by HYBRIT/SSAB and Stegra (formerly H2 Green Steel), can approach very low intensities on clean power and green hydrogen, but commercial volumes remain nascent.
Tower plate, monopile plate, castings, forgings, and fasteners are supplied overwhelmingly by BF-BOF today, because heavy plate in the required dimensions and metallurgy is not yet widely available from low-carbon routes. Low-carbon procurement is small. Vestas and ArcelorMittal introduced a low-carbon heavy-plate offering claiming a 66 percent reduction in emission intensity per kg steel, first deployed on the top two tower sections of the Baltic Power offshore project in Poland (76 V236-15.0 MW turbines), for a claimed 25 percent tower emissions reduction [14]. This is contracted, project-specific supply rather than a standard offering; most sector low-carbon-steel commitments remain memoranda of understanding rather than delivered tonnage.

4. Concrete, foundations, and substructures
Onshore gravity foundations are concrete-dominated at 390,000 to 405,000 kg/MW of concrete plus 20,000 to 55,000 kg/MW of reinforcement, for a total land-based foundation mass of roughly 410,000 to 460,000 kg/MW [15]. Offshore substructures shift the burden to steel: monopiles, jackets, suction buckets, and floating substructures span 82,000 to 360,000 kg/MW [15]. A comparative study of seven foundation types across 62 projects found monopiles carry around 26 percent lower steel-related emissions than jackets, and floating designs (semi-submersible, spar, tension-leg) carry higher emissions per kWh due to greater material requirements; that study reports floating foundations at 4.7 to 6.4 g CO₂/kWh over 25 years, falling to 2.4 to 3.2 g/kWh at 50 years [16].
Concrete emissions are governed by clinker factor and supplementary-cementitious-material (SCM) availability. The retirement of coal plants and blast furnaces reduces the supply of fly ash and blast-furnace slag, threatening to raise the clinker factor and concrete's embodied carbon over the coming decade. Foundation over-design under uncertain geotechnical conditions is a real penalty: conservative margins where site investigation is thin add concrete and steel directly to the footprint, which Vestas captures through a high-groundwater foundation sensitivity [5].
5. Blades
Blades account for about 13 percent of turbine GWP in the onshore V162 [5]. The inventory comprises glass fiber, epoxy or polyester resin, balsa and structural PET/PVC foam cores, and increasingly carbon fiber in spar caps. Carbon fiber is far more emissions-intensive per kilogram than glass fiber (roughly 20 to 30 versus 2 to 3 kg CO₂-eq/kg), but as blades lengthen it substitutes into spar caps precisely because its stiffness-to-weight enables mass and material savings; the net trade-off can favor carbon fiber where it reduces total blade mass and enables longer, higher-yield rotors, though the sign depends on the specific design. Infusion and curing energy add manufacturing burden. Leading-edge erosion is an under-quantified generation-and-emissions term: it degrades aerodynamics and forces repair campaigns that both add emissions and lose generation. The mainstream LCA literature generally omits erosion-driven performance loss, and no widely accepted quantification exists; this is a genuine, if likely small, omission.
 John D
6. Generators, magnets, rare earths, and conductors
NdFeB permanent-magnet content scales with architecture: direct-drive permanent-magnet synchronous generators carry the most magnet mass per MW, medium-speed hybrids less, and geared doubly-fed induction machines little to none. The embodied emissions of NdFeB production are large per kilogram and highly uncertain: published footprints for 1 kg of neodymium oxide range from 12 to 66 kg CO₂-eq, a more-than-fivefold spread reflecting ore grade, allocation, and boundary differences [17], and a recent figure for virgin sintered NdFeB magnet is about 52 kg CO₂-eq/kg [18]. Because China produces the overwhelming majority of NdFeB (Section 12), the carbon intensity of the dominant producing geography and the fluorinated process emissions (CF4, C2F6) from molten-salt electrolysis of rare-earth metals are decisive; these perfluorocarbons are frequently omitted from mainstream wind LCAs. Dysprosium and terbium raise high-temperature coercivity and elevate both emissions and supply risk.
Despite high per-kg intensity, magnets are a small share of total turbine GWP because they are a tiny share of mass (rare earths ~0.03 percent onshore) [10]. Copper and aluminium in windings and cabling are more consequential: copper reaches 7.2 percent of offshore plant mass driven by submarine cabling [6]. The avoided-burden end-of-life credit is largely a metals credit reflecting recycling of copper, aluminium, and steel [5].
7. Manufacturing energy and geography
An identical bill of materials yields materially different footprints depending on the grid emission factor at manufacture, because blade infusion/curing, nacelle assembly, tower rolling, and casting are energy-intensive. Vestas' inventories reflect a predominantly European supply chain; the DTU analysis cautions that the resulting 5 to 9 g CO₂-eq/kWh (net) and 7 to 13 g/kWh (gross) figures for the V90-to-V162 series should not be transferred to non-European manufacturing without revalidating local grid conditions [11]. Vestas factories themselves contribute only about 1 percent (onshore) to as much as 12 percent (some offshore categories) of totals, because the dominant emissions are upstream in materials [5][6]. Whether manufacturers may use market-based accounting (contractual renewable instruments) rather than location-based accounting is contested; market-based figures can understate physical emissions where instruments are non-additional. Best practice per the GHG Protocol Scope 2 Guidance is dual reporting, and where disclosures permit both should be stated.
"The most important thing is that the new turbine configurations are optimised on a total value-chain basis and the complete lifecycle of a wind plant"
— Martin Skov Jensen, chief engineer, Vestas
 Eize de Vries
8. Global component transport
Transport is small but non-negligible. Vestas reports transport at about 10 percent of total GWP for the onshore V162 and 3 percent for the offshore V236 [5][6]. The lower offshore share reflects the larger denominator and the emissions-efficiency of bulk sea freight per tonne-km. Transport becomes non-trivial with long overland oversize haulage (blades constrained by length and road geometry), intercontinental magnet and casting flows, and remote sites far from ports, and rises where turbines are manufactured on one continent and installed on another.
9. Installation and construction
Onshore installation emissions (access roads, crane pads, hardstanding, civil works) are captured in foundation and plant-setup stages and are generally small relative to materials. Offshore installation is more intensive: jack-up and floating installation vessels, pile-driving, scour protection, cable-lay vessels, and offshore substation installation all consume marine fuel. Offshore substation topsides and HVDC converter platforms represent substantial steel mass that must be allocated to the project. In the offshore V236 inventory, site cables and substation infrastructure rank among the top contributors alongside foundations and tower [6].
10. Grid interconnection and system-level attribution
Substation, transformer, switchgear, and project-attributable transmission are included in the reference flow of the better LCAs. A high-consequence, frequently omitted term is sulfur hexafluoride (SF6) in high-voltage switchgear: SF6 has a GWP-100 near 24,300 (AR5) and leaks slowly from gas-insulated switchgear, worsened by ageing and environmental stress [19][20]. For transmission operators SF6 can dominate Scope 1: SINTEF reports that Statnett, the Norwegian TSO, attributed 72 percent of its direct (Scope 1) emissions in 2024 to SF6 [20]. Vestas includes an SF6 term and a switchgear blow-out sensitivity [5]. The EU F-gas Regulation 2024/573 and the shift to SF6-free switchgear will reduce this term.
The most contested boundary question is whether grid reinforcement, balancing, firming, and storage should be allocated to the wind asset. The case for inclusion is that variable generation imposes real system costs a complete consequential accounting should capture. The case against is that these are system-level attributes depending on the entire generation mix, not properties of the asset, and allocating them to wind alone mis-assigns emissions that belong to the system operator. The NREL harmonization flags integration effects as typically outside LCA scope and resolvable only with system models, not asset LCAs [1]. Under an asset boundary these terms are zero; under a system boundary with gas firming at high penetration, published critiques suggest they could add several g CO₂-eq/kWh, but the magnitude is scenario-dependent and not resolvable within attributional LCA. This report reports both conventions rather than asserting one.
11. Operations and maintenance
O&M consumables include gear oil and hydraulic fluid; maintenance travel dominates the offshore O&M footprint through crew transfer vessels, service operation vessels (SOVs), and occasional helicopter operations. Major component exchange (gearboxes, generators, blades, transformers) adds embodied material. Onshore O&M is small (operation adds about +0.3 g/kWh in the V162) [5]. Offshore and especially floating O&M is material: floating-wind LCAs attribute 9 to 16 percent of GWP to O&M when a dedicated SOV model is used, and one semi-submersible case attributed as much as 40.7 percent [21][22]. Failure and replacement rates are often proprietary; where absent, LCAs use assumed replacement fractions, a genuine uncertainty source.
12. Repowering and life extension
Partial repowering retains foundations, towers, or both; full repowering replaces the turbine; life extension continues operation after a residual-life assessment. Retaining foundations and grid infrastructure avoids the most concrete- and steel-intensive components, so repowering can yield lower marginal emissions per kWh than greenfield, particularly where modern rotors substantially raise capacity factor on a proven high-wind site. The winning condition is that retained-infrastructure credit plus generation gain exceeds the emissions of new components. The University of Aberdeen peatland tool was extended in 2018 to model repowering, reflecting that on carbon-rich soils avoiding new ground disturbance is decisive [8].
13. Decommissioning and recycling
Roughly 80 to 94 percent of a turbine by mass (steel, copper, aluminium, iron, foundation rebar) is recyclable through established channels; Vestas reports turbine recyclability of 84 percent (onshore V162) and 82 percent (offshore V236) [5][6][23]. Dismantling energy is modest, and offshore practice often retains subsea foundation sections below the mudline via cutting rather than full removal, reducing decommissioning emissions but leaving material in place.
The composite blade waste problem is the genuine circularity gap. Blades are under 8 percent of turbine mass but resist recycling [23]. Commercial maturity varies sharply by pathway. Cement kiln co-processing is most mature: Veolia, partnered with GE, has processed a documented tonnage of blades as kiln feedstock, substituting for both fuel and raw material [24]. Mechanical grinding is commercial but low-value. Pyrolysis is scaling, with Carbon Rivers commercializing glass-fiber recovery. Solvolysis and chemically recyclable resins remain largely at demonstration scale: DTU's Justine Beauson stated that "chemical recycling of composite waste has only been demonstrated at lab scale" [25]. Vestas' CETEC epoxy chemical-disassembly route is being commercialized via partnerships but disclosed tonnage remains limited [25]. The distinction between demonstrated tonnage processed and announced capacity is critical: announced pyrolysis capacity exceeds demonstrated throughput by a wide margin. WindEurope has called for a Europe-wide landfill ban on decommissioned blades, and several member states have adopted restrictions, accelerating adoption.
 John D
14. Lifetime electricity generation: the denominator
The denominator governs the result. US land-based fleet and modern-project capacity factors cluster in the 35 to 45 percent range, while European offshore projects average roughly 35 to 50 percent, with the best North Sea sites and newest large turbines exceeding 50 percent [26][27]. Vestas' EPDs embed implied capacity factors of about 39.7 percent (onshore V162, low-wind class) and 48.3 percent (offshore V236, high-wind class) [5][6]. Availability is typically 97 to 98 percent, electrical losses to interconnection a few percent, and intra-plant wake losses around 6 percent onshore and higher offshore [5][6].
Cluster-scale wake effects are a systematic, often under-counted denominator risk. Mesoscale North Sea studies (Akhtar et al.) find densely spaced clusters can reduce neighboring capacity factors by around 20 percent, with wakes extending 40 km or more; a German Bight assessment found wake-induced yield reductions of 30 percent, half from cross-border wake accumulation [28][29]. These losses reduce lifetime generation and thus raise per-kWh emissions proportionately, and are largely absent from single-plant LCAs.
The degradation-rate disagreement propagates directly into the result. Staffell and Green's analysis of 282 UK wind farms found that "wind turbines are found to lose 1.6±0.2% of their output per year, with average load factors declining from 28.5% when new to 21% at age 19," reducing 20-year output by about 12 percent and raising LCOE by roughly 9 percent [30]. Earlier work by Hughes for the Renewable Energy Foundation suggested far steeper declines of 5 to 13 percent per year, which the Staffell and Green wind-speed-corrected analysis rejected [30]. A 1.6 percent/year rate raises per-kWh lifecycle emissions by roughly 6 to 12 percent versus a no-degradation assumption; the discredited high-degradation figures would roughly double the footprint, illustrating how one contested parameter can change a conclusion. Manufacturer EPDs assume 20-year (onshore) to 30-year (offshore) design lives [5][6].
15. Net avoidance and break-even
Energy payback time is short: IPCC AR5 reports a median near 5.4 months, and reviews (Kaldellis and Apostolou) find most onshore and offshore studies under one year [3][31]. Vestas reports energy breakeven of 6.5 months (onshore V162, return-on-energy 37×) and 13.4 months (offshore V236, 27×) [5][6]. Meta-analytic EROI is around 20:1 or better [31].
Carbon break-even must be presented as a function of the displaced grid emission factor, not a single number. Let L be the wind asset's lifecycle intensity and G the displaced grid intensity. Net avoidance per kWh is (G − L), and break-even time equals embodied emissions divided by annual avoided emissions.
For L ≈ 11 g/kWh: against a coal grid (G ≈ 950 g/kWh) the asset offsets its lifetime burden in roughly 1.2 percent of its life, a few months; against a gas grid (G ≈ 450 g/kWh) in about one year; against a grid at 100 g/kWh, roughly 12 percent of life; and as G approaches L, break-even diverges toward the full lifetime and beyond. The critical insight, confirmed by Smith, Nayak and Smith, is that as grids decarbonize the counterfactual weakens and break-even lengthens; wind built to displace an already-clean grid delivers little net saving and may never pay back on carbon-rich soils [7].
The grid-factor choice is decisive. Average factors give a mid-range answer. Short-run marginal factors (what actually backs off when wind generates, often gas or coal) typically give faster break-even than average. Long-run marginal and consequential factors, which account for capacity investment, can give slower break-even in systems adding renewables anyway. The concept degrades as the displaced grid approaches zero carbon: near zero-carbon grids, wind's climate value shifts from displacement to enabling electrification and displacing future fossil capacity, which break-even does not capture. Embodied emissions are front-loaded at construction while avoidance is distributed over decades; time-explicit or discounted metrics slightly lengthen effective payback but do not change the qualitative conclusion for high-carbon grids, mattering most precisely where the grid is already clean.
16. Land use, ecosystem carbon, and siting
For most sites, soil-carbon disturbance and forestry clearance are minor. The decisive exception is peatland. The University of Aberdeen carbon calculator (Nayak et al., Smith et al.), mandatory for Scottish wind planning, quantifies emissions from peat excavation and drainage [8]. Under adverse conditions (deep peat, extensive drainage, abandoned management) soil and plant GHG emissions can reach 77 percent of a wind farm's gross carbon savings, and Smith, Nayak and Smith concluded that wind farms on undegraded peatlands are unlikely to reduce future carbon emissions once projected grid decarbonization is accounted for [7]. The calculator's turbine-manufacturing term spans 394 to 8,147 t CO₂ per MW depending on inputs [32]. Good siting and strict management are decisive; peatland is the one siting condition where ecosystem carbon loss can dominate the manufacturing footprint.
17. Non-CO₂ and fugitive emissions
Beyond SF6 (Section 10), the inventory contains perfluorocarbons (CF4, C2F6) from primary aluminium smelting and from rare-earth molten-salt electrolysis, both high-GWP and frequently omitted or aggregated. Refrigerants in nacelle cooling are minor. Methane appears via natural gas in steel and glass-fiber production and via coal-mining fugitives upstream of BF-BOF steel; Vestas attributes about 6 percent of GWP-contributing substances to methane [5]. The mainstream literature captures CO₂ and methane well, SF6 inconsistently, and process perfluorocarbons poorly.
18. Uncertainty, sensitivity, and harmonization
The NREL harmonization (Dolan and Heath 2012) screened approximately 240 LCAs and retained 72; after adjusting to consistent gross boundaries and key parameters, "the total range was reduced by 47% to 3.0 to 45 g CO₂-eq/kWh and the IQR was reduced by 14% to 10 g CO₂-eq/kWh, while the median remained relatively constant (11 g CO₂-eq/kWh)," with the NREL fact sheet stating harmonization "reduces the variability by 42% and lowers the median value from 12 g to 11 g CO₂eq/kWh"; harmonizing capacity factor produced the single largest reduction in variance [1][2]. IPCC AR5 gives medians of about 11 g/kWh (onshore) and 12 g/kWh (offshore) [3]. UNECE (2021, updated 2022) reports 7.8 to 16 g/kWh onshore and 12 to 23 g/kWh offshore [4]. These three anchors are mutually consistent once boundaries and capacity factors are aligned.
Distinguishing uncertainty types: parameter uncertainty (capacity factor, degradation, magnet intensity, steel route) is largest and most reducible. Scenario uncertainty (displaced grid, future SCM availability, cluster-wake build-out) is large and irreducible by better inventory data. Model structural uncertainty (attributional versus consequential, cut-off versus avoided-burden, process versus hybrid LCA) shifts the result by tens of percent and must be reported as a choice, not a measurement. The parameters that dominate variance, in order, are capacity factor, end-of-life allocation convention, steelmaking route, degradation rate, and (site-specific) peatland disturbance.
19. Key players and stakeholders
Original equipment manufacturers concentrate in a few firms: Vestas (CPH:VWS), Siemens Energy (ETR:ENR, parent of Siemens Gamesa), GE Vernova (NYSE:GEV), Nordex (ETR:NDX1), and the Chinese majors Goldwind (SHE:002202; HKG:2208) and Envision. Vestas is the disclosure leader, with a two-decade series of critically reviewed ISO LCAs whose performance dataset covers roughly 18 percent of global installed capacity [6]. Developers and asset owners such as Ørsted (CPH:ORSTED) increasingly specify low-carbon inputs. Materials and component suppliers include ArcelorMittal (NYSE:MT) and emerging steel producers Stegra and SSAB (OTC:SSABF), and a magnet supply chain concentrated in China. Certification and verification bodies (EPD program operators), standards organizations (ISO, IEC, CEN), regulators and procurement authorities, and the recycling and waste sector (Veolia, Stena Recycling, Carbon Rivers, and cement producers such as Holcim (SIX:HOLN)) complete the map. The single-point dependency of greatest concern is Chinese dominance of rare-earth processing and NdFeB magnets (Section 21).
19.1 US Domestic NdFeB Magnets
A domestic North American magnet capability has taken shape since 2024, though its bearing on wind lifecycle emissions remains prospective rather than demonstrated, and the distinction between processed tonnage and announced capacity applies here with the same force it applies to blade recycling. Demonstrated production is thin and recent. MP Materials (NYSE:MP) restored commercial sintered NdFeB output at its Independence facility in Fort Worth, Texas during 2025, the first end-to-end domestic magnet capability in decades, and announced in February 2026 a 1.25 billion dollar campus at Northlake, Texas intended to bring total capacity to approximately 10,000 tonnes per year, with commissioning stated to begin in 2028 and supported by a ten-year Pentagon offtake commitment [35]. Noveon Magnetics, privately held and operating from San Marcos, Texas on a magnet-to-magnet recycling route, and e-VAC Magnetics, the Sumter, South Carolina subsidiary of Germany's Vacuumschmelze, which reported its first commercial United States magnet shipments in December 2025, are the other operating producers [36][37]. USA Rare Earth (NASDAQ:USAR) reported commissioning the first phase of its Stillwater, Oklahoma line in March 2026, with customer shipments expected in the second quarter of that year and a stated capacity near 1,200 tonnes once the second line completes [38]. Arnold Magnetic Technologies, a subsidiary of Compass Diversified (NYSE:CODI), is not a new entrant but a long-established finisher whose March 2026 distribution agreement with USA Rare Earth pairs existing manufacturing capability with new domestic feedstock [38]. Announced capacity substantially exceeds any of this: the United States Department of Commerce signed a non-binding preliminary letter of intent in November 2025 to provide 50 million dollars in CHIPS Act incentives to Vulcan Elements, taking equity in exchange, against a company plan to produce up to 10,000 tonnes of NdFeB material over several years [39]. Reporting that aggregates company statements places total announced United States capacity near 40,000 tonnes annually, roughly double one industry estimate of domestic demand, against a 2022 Department of Energy assessment putting 2020 demand at 16,000 tonnes and projecting 37,000 tonnes by 2030 under a high-growth scenario [40].
For lifecycle accounting the relevant question is not security of supply but whether relocation changes the emission factor of the magnet stream, and the available evidence implies two effects working in the same direction. Production moved from the Chinese grid to the United States grid carries a lower electricity emission factor for identical process steps, the same mechanism identified in Section 7. More consequentially, the recycled and closed-loop feedstock routes that Noveon, Vulcan Elements, and MP Materials each employ bypass the mining, solvent extraction, and molten salt electrolysis stages that dominate the 12 to 66 kg CO₂-eq per kilogram range reported for neodymium oxide and that generate the fluorinated process emissions discussed in Section 17 [17][18]. MP Materials further states that its Northlake process will incorporate grain boundary diffusion to reduce or eliminate heavy rare earth content while preserving coercivity, which if demonstrated at scale would ease both the dysprosium and terbium supply exposure identified in Section 22 and the processing burden those elements carry [35]. No third-party verified environmental product declaration for United States sintered NdFeB was identified, so the magnitude of any reduction cannot be quantified from primary disclosure and these remain manufacturer claims.
The qualification that matters most for this report is that none of these producers has publicly qualified magnets into a utility-scale wind drivetrain, the stated end markets being defense, semiconductor equipment, robotics, and automotive traction motors. Domestic magnet capacity therefore reduces the supply concentration risk identified above well before it reduces the embodied carbon of any turbine.

20. Economic and industrial dynamics (feasibility inputs)
Commercial dynamics enter only as feasibility constraints, not as an investment thesis. Supply-chain capacity for low-carbon steel is the binding constraint on decarbonizing the largest material stream: H2-DRI plants are only now reaching commercial operation and cannot yet supply heavy plate in wind volumes, so near-term low-carbon steel in turbines is limited to project-specific offtakes such as Vestas-ArcelorMittal at Baltic Power [14]. Decarbonized materials carry a cost premium; absent non-price procurement criteria there is weak pull-through. Funding pathways for recycling infrastructure are immature: cement co-processing is self-sustaining but low-value, while pyrolysis and chemical recycling need capital and policy support to scale from demonstrated tonnage to announced capacity. Industrial capability to produce low-carbon inputs at volume is the relevant question.
21. Regulatory landscape
The EU Carbon Border Adjustment Mechanism (CBAM) applies to imported steel, aluminium, and cement, and its definitive regime raises the delivered cost of high-carbon imported inputs, indirectly incentivizing lower-carbon steel in turbines sold into the EU. Corporate disclosure under CSRD/ESRS E1 and the ISSB standards is pushing OEMs and developers toward verified product carbon footprints. EPD and ecodesign requirements (EN 15804, the Ecodesign for Sustainable Products Regulation) are formalizing the disclosure basis. Non-price sustainability criteria are entering renewable auctions in the Netherlands, Germany, Denmark, and the UK Contracts for Difference sustainable-industry rewards. The EU F-gas Regulation 2024/573 progressively restricts SF6 in switchgear [20]. Chemical restrictions bear on coatings, lubricants, and resins; waste and landfill regulation, including the WindEurope-backed blade landfill-ban push, bears on end-of-life. Domestic-content and industrial-policy instruments can conflict with lifecycle objectives where they force manufacturing into higher-carbon grids (Section 22).
22. Geopolitical and strategic dimensions
Supply concentration in permanent-magnet and rare-earth processing is the dominant strategic risk. Per the IEA, China accounted for about 60 percent of global mined production of magnet rare earths in 2024, roughly 91 percent of rare-earth refining capacity, and about 94 percent of finished NdFeB permanent-magnet production [17][34]. In April 2025 China's Ministry of Commerce imposed licensing on seven medium and heavy rare earths (samarium, gadolinium, terbium, dysprosium, lutetium, scandium, yttrium) and on NdFeB magnets containing terbium or dysprosium; October 2025 measures extended extraterritorial control to products containing as little as 0.1 percent Chinese-origin material [33][34]. Chinese magnet exports fell sharply and ex-China dysprosium and terbium prices reached up to six times Chinese domestic levels [34]. These controls both constrain availability and accelerate substitution toward geared/DFIG architectures that avoid heavy-rare-earth magnets, and toward magnet recycling. The carbon consequence of manufacturing relocation is real: shifting production from a low-carbon to a high-carbon grid raises the footprint for an identical bill of materials (Section 7), so industrial-policy objectives (reshoring, domestic content) can conflict directly with lifecycle-emissions objectives.
Risk Matrix
| Risk | Likelihood | Impact | Mitigation |
|---|---|---|---|
| Capacity-factor overstatement in EPDs inflates the denominator and understates g/kWh | High | High | Require EPDs to disclose assumed capacity factor and design life; recompute at site-specific values before comparison |
| End-of-life allocation convention (cut-off vs avoided-burden) undisclosed, breaking comparability | High | High | Mandate dual reporting of gross and net figures; harmonize on gross boundaries for cross-study comparison |
| Steelmaking route unknown or assumed BF-BOF | High | High | Require route-specific EPDs for tower/monopile plate; procure EAF or H2-DRI where available |
| Displaced-grid factor mis-specified (average vs marginal) changes break-even conclusion | High | High | Report break-even as a function of grid factor; use scenario-consistent marginal factors |
| Cluster-scale wake losses reduce lifetime generation below plan | Medium | Medium-High | Incorporate mesoscale wake modeling into yield assessment; treat cross-border wakes explicitly |
| Degradation rate underestimated (assumed 0 vs 1.6%/yr) | Medium | Medium | Apply empirically grounded 1.6%/yr; sensitivity-test to 2%/yr |
| Peatland/organic-soil siting consumes carbon savings | Medium (site-specific) | Very High (where it occurs) | Apply peatland carbon calculators; avoid deep undegraded peat; enforce strict site management |
| SF6 leakage omitted from switchgear inventory | Medium | Medium | Include SF6 charge and leakage; deploy SF6-free switchgear |
| Rare-earth/magnet supply disruption forces redesign or delay | High | Medium (carbon), High (schedule) | Diversify to geared architectures; scale magnet recycling; qualify non-Chinese supply |
| Blade recycling capacity fails to match waste volume (announced vs demonstrated) | Medium | Medium | Fund pyrolysis/chemical recycling scale-up; enforce landfill bans with lead time |
| Process perfluorocarbons (CF4, C2F6) and aluminium PFCs omitted | Medium | Low-Medium | Extend inventory boundaries to capture smelting and RE-electrolysis PFCs |
Recommendations
For GHG accounting practitioners and carbon auditors verifying wind asset claims. Never accept a per-kWh figure without recovering the assumed capacity factor and design life, because these drive the headline more than the inventory: a figure at 48 percent capacity factor is not comparable to one at 30 percent even with identical inventories [5][6]. Require disclosure of the end-of-life allocation convention and demand both gross and net figures, since the avoided-burden credit alone moved the V162 figure by 34 percent [5]. Verify the steelmaking route behind the largest mass stream, and confirm whether SF6 and process PFCs are in scope. Reconcile any manufacturer figure against the NREL, IPCC AR5, and UNECE anchors after normalizing boundaries [1][3][4]. The threshold that should change your verification opinion: if capacity factor is undisclosed or exceeds regional fleet norms by more than a few points, treat the per-kWh figure as unsubstantiated.
For LCA methodologists and standards bodies. Standardize a mandatory disclosure block for wind EPDs covering capacity factor, design life, degradation rate, allocation convention, GWP vintage, and grid-factor basis. Publish gross (boundary-consistent) figures alongside net to preserve comparability, following the NREL harmonization logic [1]. Develop a consensus treatment of cluster-scale wake losses so lifetime generation is not systematically overstated in dense build-out regions [28][29]. Establish default inventory values for NdFeB magnet and process-PFC emissions to compress the fivefold spread in magnet footprints [17].
For developers, asset owners, and procurement authorities. Specify route-specific low-carbon steel for towers and monopiles where available, recognizing current supply is limited to project offtakes [14]. Avoid deep undegraded peat and apply carbon calculators at siting, since peatland can consume most of a project's carbon savings [7][8]. Incorporate mesoscale wake modeling into yield assessment to avoid overstating lifetime generation. Contract for demonstrated blade-recycling tonnage rather than announced capacity, and plan for landfill bans.
For policymakers designing auction criteria and disclosure requirements. Introduce non-price carbon and circularity criteria into auctions with verification tied to standardized EPDs, so low-carbon steel and blade recyclability command a procurement premium. Align CBAM, CSRD/ESRS E1, and F-gas regulation so obligations reinforce rather than duplicate. Recognize the tension between domestic-content policy and lifecycle emissions: reshoring to a high-carbon grid raises the footprint, so pair industrial policy with grid decarbonization or clean-manufacturing requirements [12].
Caveats
The convergence near 11 g CO₂-eq/kWh reflects predominantly European manufacturing and should not be transferred to high-carbon manufacturing geographies without revalidation [11]. Manufacturer EPDs, while critically reviewed, are self-commissioned and use favorable wind classes; their figures are claims requiring the assumptions to be recovered. Floating offshore, cluster-wake, blade-recycling, and process-PFC evidence is thinner than the onshore inventory base, and those sections carry correspondingly lower confidence. Break-even figures are joint properties of turbine and grid and are meaningless without stating the displaced-grid factor. Several contested boundary questions (system-firming allocation, market-based accounting) cannot be resolved within attributional LCA and are reported under both conventions rather than decided.

References
[1] Dolan, Stacey L., and Garvin A. Heath. 2012. "Life Cycle Greenhouse Gas Emissions of Utility-Scale Wind Power: Systematic Review and Harmonization." Journal of Industrial Ecology 16 (S1): S136–S154.
[2] National Renewable Energy Laboratory. 2013. "Wind LCA Harmonization." NREL/FS-6A20-57131. Golden, CO: NREL.
[3] Schlömer, S., T. Bruckner, L. Fulton, E. Hertwich, A. McKinnon, D. Perczyk, J. Roy, R. Schaeffer, R. Sims, P. Smith, and R. Wiser. 2014. "Annex III: Technology-Specific Cost and Performance Parameters." In Climate Change 2014: Mitigation of Climate Change. Contribution of Working Group III to the Fifth Assessment Report of the IPCC. Cambridge University Press.
[4] United Nations Economic Commission for Europe. 2021 (updated 2022). Life Cycle Assessment of Electricity Generation Options / Carbon Neutrality in the UNECE Region: Integrated Life-cycle Assessment of Electricity Sources. Geneva: UNECE.
[5] Vestas Wind Systems A/S. 2023. Life Cycle Assessment of Electricity Production from an Onshore EnVentus V162-6.2 MW Wind Plant. Aarhus: Vestas.
[6] Vestas Wind Systems A/S. 2024. Life Cycle Assessment of Electricity Production from an Offshore V236-15 MW Wind Plant. Aarhus: Vestas.
[7] Smith, Jo, Dali Rani Nayak, and Pete Smith. 2014. "Wind Farms on Undegraded Peatlands Are Unlikely to Reduce Future Carbon Emissions." Energy Policy 66: 585–591.
[8] Nayak, Dali Rani, David Miller, Andrew Nolan, Pete Smith, and Jo U. Smith. 2010. "Calculating Carbon Budgets of Wind Farms on Scottish Peatlands." Mires and Peat 4: Article 9.
[9] European Commission Joint Research Centre. 2024. Material Requirements for Wind Turbines. JRC139701. Luxembourg: Publications Office of the European Union.
[10] Kim, Junbeum, et al. 2022. "Material Consumption and Environmental Impact of Wind Turbines in the USA and Globally." Resources, Conservation and Recycling 174: 105871.
[11] Technical University of Denmark. "Simple Model for Estimating CO2 Emissions of Wind Turbines." DTU Research Database.
[12] International Renewable Energy Agency. 2023. "Iron and Steel." In Decarbonising Hard-to-Abate Sectors with Renewables. Abu Dhabi: IRENA.
[13] International Energy Agency. 2020. Iron and Steel Technology Roadmap. Paris: IEA.
[14] ArcelorMittal (Constructalia). 2024. "Vestas Introduces ArcelorMittal's Low Carbon Emissions Steel Offering for Wind Turbines."
[15] OpenEI / National Renewable Energy Laboratory. Renewable Energy Materials Properties Database (REMPD), Wind Overview.
[16] Lotfizadeh, et al. 2026. "Material and Carbon Intensity of Offshore Wind Foundations for Sustainable Infrastructure." Journal of Cleaner Production.
[17] Zaimes, George G., et al. 2015. "Life-Cycle Assessment of the Production of Rare-Earth Elements for Energy Applications: A Review." Frontiers in Energy Research 3: 45.
[18] Ma, et al. 2025. "Dynamic Life Cycle Assessment of NdFeB Magnet Production: Case for Carbon Emission Intensity." Frontiers in Energy Research.
[19] "SF6 Leakage Risk in Gas-Insulated Switchgear under the Interaction of Ageing and Environmental Stress." 2026. Energy Reports / ScienceDirect.
[20] SINTEF Energy. 2024. "What Is the Status of Phasing Out SF6 Gas in Switchgear and Circuit Breakers?" SINTEF Blog.
[21] MacAskill, et al. 2023. "Life Cycle Assessment of Four Floating Wind Farms around Scotland Using a Site-Specific Operation and Maintenance Model with SOVs." Energies 16 (23): 7739.
[22] "Assessing the Life Cycle Environmental Performance of Floating Wind Turbines." 2026. Journal of Marine Science and Engineering 14 (6): 577.
[23] American Clean Power Association. 2023. Decommissioned Wind Turbine Blade Management Strategies. Washington, DC: ACP.
[24] CompositesWorld. 2022. "Moving toward Next-Generation Wind Blade Recycling."
[25] Reuters Events. 2021. "Wind Suppliers Predict Blade Recycling Network by 2025."
[26] U.S. Department of Energy / Lawrence Berkeley National Laboratory. 2024. Land-Based Wind Market Report: 2024 Edition.
[27] National Renewable Energy Laboratory. 2024. Annual Technology Baseline: Offshore Wind.
[28] Akhtar, Naveed, Beate Geyer, Burkhardt Rockel, Philipp S. Sommer, and Corinna Schrum. 2021. "Accelerating Deployment of Offshore Wind Energy Alter Wind Climate and Reduce Future Power Generation Potentials." Scientific Reports 11: 11826.
[29] Fliegner, et al. 2025. "Cross-Border Cooperation to Mitigate Wake Losses in Offshore Wind Energy: A 2050 Case Study for the North Sea." International Journal of Energy Research.
[30] Staffell, Iain, and Richard Green. 2014. "How Does Wind Farm Performance Decline with Age?" Renewable Energy 66: 775–786.
[31] Kubiszewski, Ida, Cutler J. Cleveland, and Peter K. Endres. 2010. "Meta-Analysis of Net Energy Return for Wind Power Systems." Renewable Energy 35 (1): 218–225.
[32] ClimateXChange. 2024. Carbon Calculator for Wind Farms on Scottish Peatlands: An Evidence Assessment. Edinburgh: ClimateXChange.
[33] Center for Security and Emerging Technology. 2025. Translation: PRC Ministry of Commerce Notice 2025 No. 61 on Rare-Earth Export Controls. Georgetown University.
[34] International Energy Agency. 2025. "With New Export Controls on Critical Minerals, Supply Concentration Risks Become Reality." IEA Commentary.
[35] MP Materials Corp. 2026. "MP Materials Selects Northlake, Texas, as the Site of '10X,' a New U.S. Rare Earth Magnet Manufacturing Campus." February 26.
[36] Noveon Magnetics. 2026. Company disclosures on Series C financing and magnet-to-magnet production capacity, San Marcos, Texas.
[37] e-VAC Magnetics. 2026. Company disclosures on Sumter, South Carolina facility commissioning and first commercial shipments.
[38] USA Rare Earth, Inc. 2026. "USA Rare Earth and Arnold Magnetic Technologies Partner to Expand U.S.-Made Rare Earth Magnet Supply for Critical Industries." March 23.
[39] U.S. Department of Commerce, CHIPS Program Office. 2025. "Department of Commerce Announces CHIPS Incentives Letter of Intent with Vulcan Elements to Support Domestic Manufacturing of Critical Rare Earth Magnets." November.
[40] The Wire China. 2026. "The Magnet Makers." March 15.