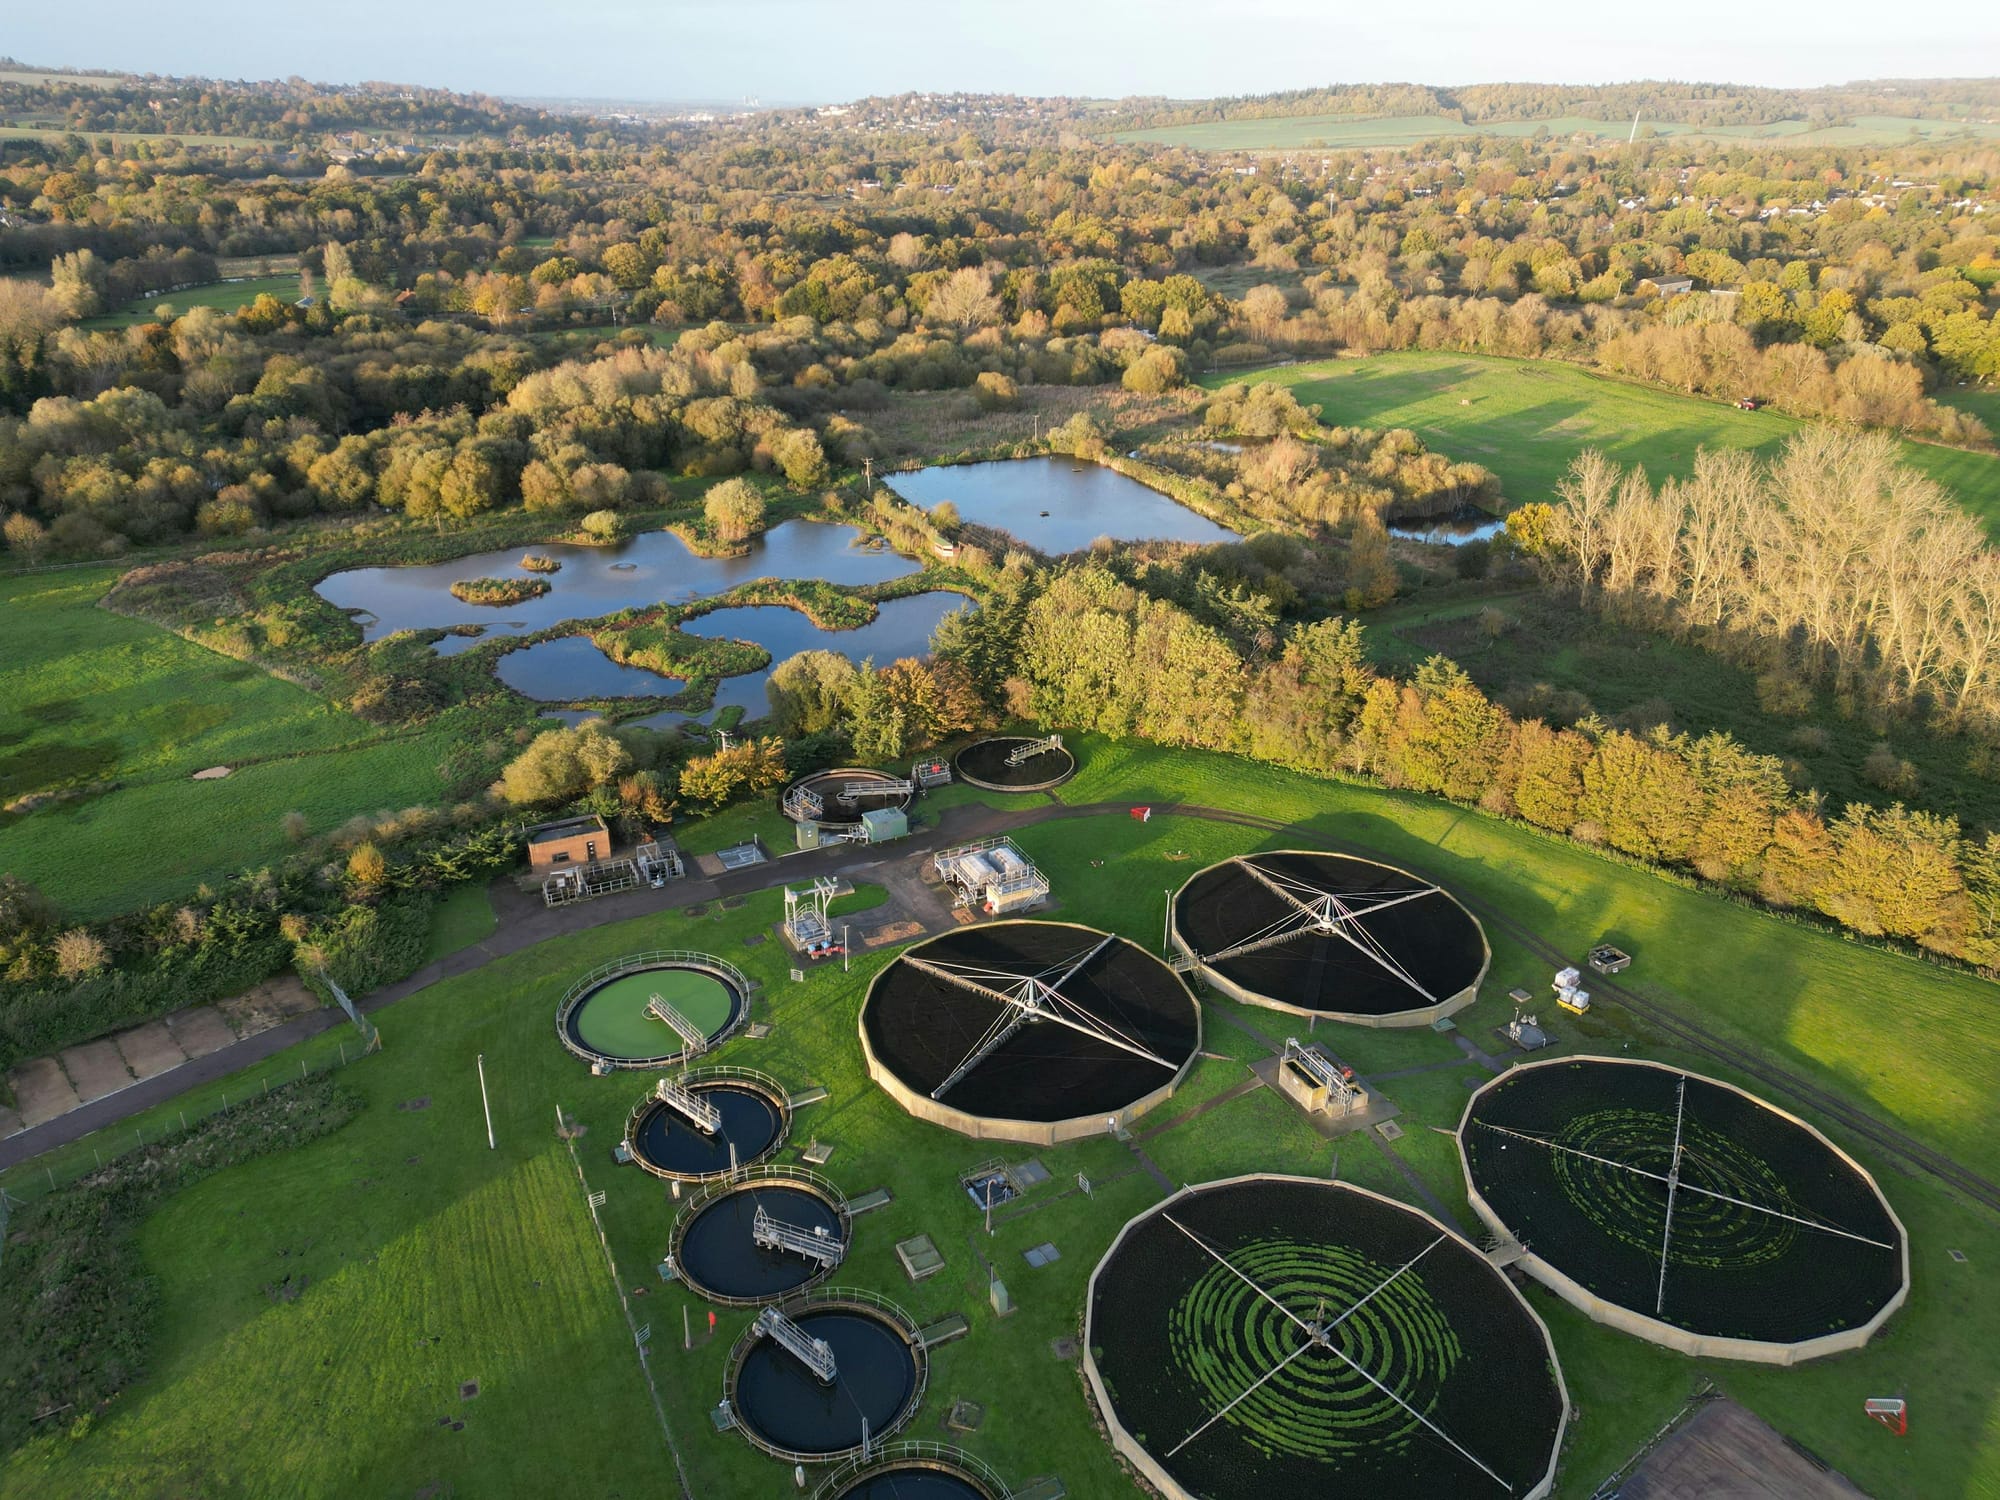
Containerized Water Treatment for Residential Development: MBR, MBBR, and Modular Bioreactors as an Alternative to Centralized Sewers
Containerized MBR bioreactors can serve greenfield subdivisions in weeks, not years.

Containerized Bioreactor Systems for Rapid Residential Development: Modular Water Treatment at the Edge of Urban Expansion
TL;DR
• Containerized and skid-mounted bioreactor systems (MBR, MBBR, SBR, aerobic granular sludge, and MABR) have matured from temporary/industrial niches into a credible primary servicing option for greenfield subdivisions, peri-urban expansion zones, workforce camps, and disaster-recovery housing, with vendor-quoted deployment timelines of weeks rather than the years required to extend centralized sewers; but adoption is constrained more by regulatory fragmentation and financing models than by technology.
• The economic case is strongest where centralized connection is delayed or unavailable: small package plants typically cost USD 500–2,500 per GPD of capacity (USD 3–15 million per MGD) and command a 20–40% capital premium for MBR over conventional activated sludge, but unlock developments that would otherwise stall; Water-as-a-Service (WaaS) and lease-plant models from vendors such as AUC Group, Seven Seas Water Group, Veolia, and Newterra are now eliminating the developer capex barrier entirely.
• The strategic context is favorable and structural: the US EPA's 2022 Clean Watersheds Needs Survey identifies USD 630 billion in clean-water needs over 20 years and the 2023 Drinking Water Infrastructure Needs Survey identifies USD 625 billion in drinking-water needs (the 2025 ASCE Report Card maintained D+/C− grades), UN-Habitat's 2024 Annual Report and 2024 World Cities Report document more than 1.12 billion people in slums or informal settlements, and 25 countries housing one-quarter of the global population now face extremely high water stress (WRI Aqueduct 4.0, Kuzma et al. 2023) — but decision makers should treat market-size forecasts (USD 29 billion to USD 60 billion for the packaged-wastewater segment alone by 2033, per Grand View Research) with caution given large definitional inconsistencies across research houses.
Key Findings
1. Technology is no longer the binding constraint. Full-scale peer-reviewed performance data confirm that all four dominant biological processes; MBR, MBBR, SBR, and aerobic granular sludge (Nereda) reliably produce effluent meeting reuse-grade standards in compact footprints suitable for shipping-container or skid enclosures. MBR plants routinely achieve >99% BOD removal, >99% TSS removal, and 4–6 log virus/bacteria reduction. Aerobic granular sludge plants (Nereda) achieve TN <7 mg/L and TP <1 mg/L while consuming exactly 13.9 kWh (PE150·year)⁻¹ — 58–63% below the Dutch conventional activated-sludge average per Pronk et al. (2015, Water Research 84:207–217) on the Garmerwolde plant.
2. The dominant binding constraint is centralized capacity and capital, not effluent quality. EPA's 2022 Clean Watersheds Needs Survey (April 2024 Report to Congress) identified USD 630 billion in unfunded clean-water capital needs over the next 20 years (a 73% increase over 2012) and the ASCE's 2025 Report Card flagged a USD 690 billion combined wastewater/stormwater funding gap by 2044, with only about 30% of the annual USD 99 billion need currently met. The IIJA's USD 50 billion water allocation (USD 11.7 billion to the Clean Water State Revolving Fund) closes only a fraction. In this environment, a developer who cannot wait 5–15 years for sewer extension has a market-clearing alternative in containerized treatment, particularly under WaaS contracting.
3. Regulatory fragmentation is the most under-appreciated risk. The US has no unified federal pathway for decentralized residential treatment systems; permitting runs through state agencies (TCEQ in Texas, RWQCBs in California under Title 22, ADEQ in Arizona) with sharply different effluent class definitions, setback requirements, and reuse approvals. Internationally, EU Regulation 2020/741 (in force June 2023) and Singapore's NEWater framework offer cleaner harmonized pathways but still impose substantial validation burdens. NSF/ANSI 350-2022 has emerged as the de facto product-certification benchmark for onsite reuse in North America.
4. Supply chains for the most critical component, membranes, are geographically concentrated and partly Asian-controlled. Reverse-osmosis and ultrafiltration membranes underpin MBR, MABR, and downstream reuse polishing. The dominant suppliers; DuPont (US), Toray (Japan), Hydranautics (Nitto Denko, Japan, with US fabrication), LG Chem (South Korea), Suez/Veolia (France), and Vontron (China, holding 45% market share in China's industrial RO sector per Chemical Research Insight 2025), leave US-based developers exposed to transpacific shipping risk, tariffs, and currency volatility. North America retains roughly 42.6% of global RO demand (Coherent Market Insights 2024) but a thinner share of upstream manufacturing.
5. Market sizing varies widely and should be treated as directional, not authoritative. Grand View Research sizes the global packaged wastewater treatment market at USD 28.89 billion in 2024 → USD 60 billion by 2033 (8.8% CAGR); MarketsandMarkets sizes the global MBR market at USD 4.15 billion in 2024 → USD 6.75 billion by 2030 (8.5% CAGR); Grand View prices the same MBR market at USD 3.8 billion → USD 5.77 billion (7.4% CAGR); Verified Market Research at USD 4 billion → USD 7.39 billion by 2032 (8.9% CAGR); Mordor Intelligence's wider Water and Wastewater Treatment Technologies estimate is USD 65 billion in 2025 → USD 87.60 billion by 2030. These differ on scope (equipment-only vs. installed value vs. WaaS recurring revenue) and category boundaries, not just on growth assumptions.
Details
1. Technology and Engineering Fundamentals
Membrane Bioreactor (MBR). MBR systems integrate suspended-growth biological treatment with microfiltration or ultrafiltration membranes (hollow fiber or flat sheet), eliminating secondary clarifiers and producing effluent with TSS effectively zero, BOD typically <5 mg/L, and 4–6 log pathogen reduction. Specific energy consumption ranges from approximately 0.4 to 2.3 kWh/m³ depending on scale and design (Krzeminski et al. 2012 via PubMed; PMC 2023 review), with aeration accounting for >50% of energy use. Membrane-related modules alone consume 0.5–0.7 kWh/m³, with flat-sheet configurations 33–37% more energy-intensive for membrane aeration than hollow-fiber. Membrane fouling remains the dominant operational failure mode, accounting for an estimated 25% of MBR downtime per Market Growth Reports (2024). Hollow fiber dominates with 55.74% of MBR market share (Mordor Intelligence 2025). Submerged MBRs hold approximately 77% share of configurations (Grand View Research 2024).
Moving Bed Biofilm Reactor (MBBR). MBBR uses free-floating polyethylene carriers as biofilm substrate inside an aerated tank, yielding high volumetric biomass concentrations without requiring sludge return. Key advantages include shock-load resistance, low sludge production, ability to retrofit existing tankage, and lower operator skill requirements than MBR; the principal disadvantages are biofilm sloughing into effluent (requiring downstream clarification) and abrasion of plastic media requiring periodic replacement. Field experience from Nakhli et al. (2014) and subsequent reviews in Journal of Environmental Chemical Engineering (Ahmad et al. 2022) documents stable performance under organic, hydraulic, and salt shock loads.
Sequencing Batch Reactor (SBR). SBR cycles fill, react, settle, decant, and idle stages in a single tank, providing process flexibility, lower capex than MBR (no membranes), and compatibility with batch dosing and intermittent flows typical of small developments. SBR is the workhorse for small-to-medium decentralized installations where space is constrained but capital is also constrained.
Aerobic Granular Sludge (Nereda). Aerobic granular sludge was developed at Delft University of Technology (Prof. Mark van Loosdrecht) and commercialized by Royal HaskoningDHV with STOWA (the Dutch foundation for applied water research) and Dutch water boards. Pronk et al. (2015, Water Research 84:207–217) reported on the full-scale Garmerwolde plant (Netherlands, 91,583 PE): granule bed >8 g/L sustained; sludge volume index of 45 mL/g after 5 minutes settling; effluent <7 mg N/L and <1 mg P/L met year-round; energy use of exactly 13.9 kWh (PE150·year)⁻¹, 58–63% below the Dutch CAS benchmark. As of 2023, Royal HaskoningDHV reports more than 100 Nereda projects in 21 countries across six continents, with cumulative savings of 58 million kWh of electricity and avoidance of 41,100 tonnes of CO₂ emissions; the Fort Pierce, Florida plant (serving 140,000 residents) marked the 100th milestone and was reported by Aqua-Aerobic Systems as 15% cheaper to construct and 30% lower in operating energy than alternatives evaluated. Pronk et al. (2017, Water Practice & Technology 12(4):987 996) provides a peer-reviewed update on global deployment. Footprint reduction is approximately 75% versus conventional activated sludge per vendor data.
Membrane Aerated Biofilm Reactor (MABR). A newer entrant exemplified by Fluence Corporation's Aspiral™ family (also OxyMem, now DuPont). A spirally wound, self-respiring membrane provides oxygen via diffusion to a biofilm on one side while denitrification proceeds in the bulk anoxic phase. Fluence reports up to 90% aeration-energy reduction versus conventional activated sludge. Aspiral models are packaged in 20- or 40-foot ISO containers with capacities of 20–350 m³/day (5,250–92,000 GPD); installation can occur within one month of order, and effluent meets China Class 1A and California Title 22 reuse standards.
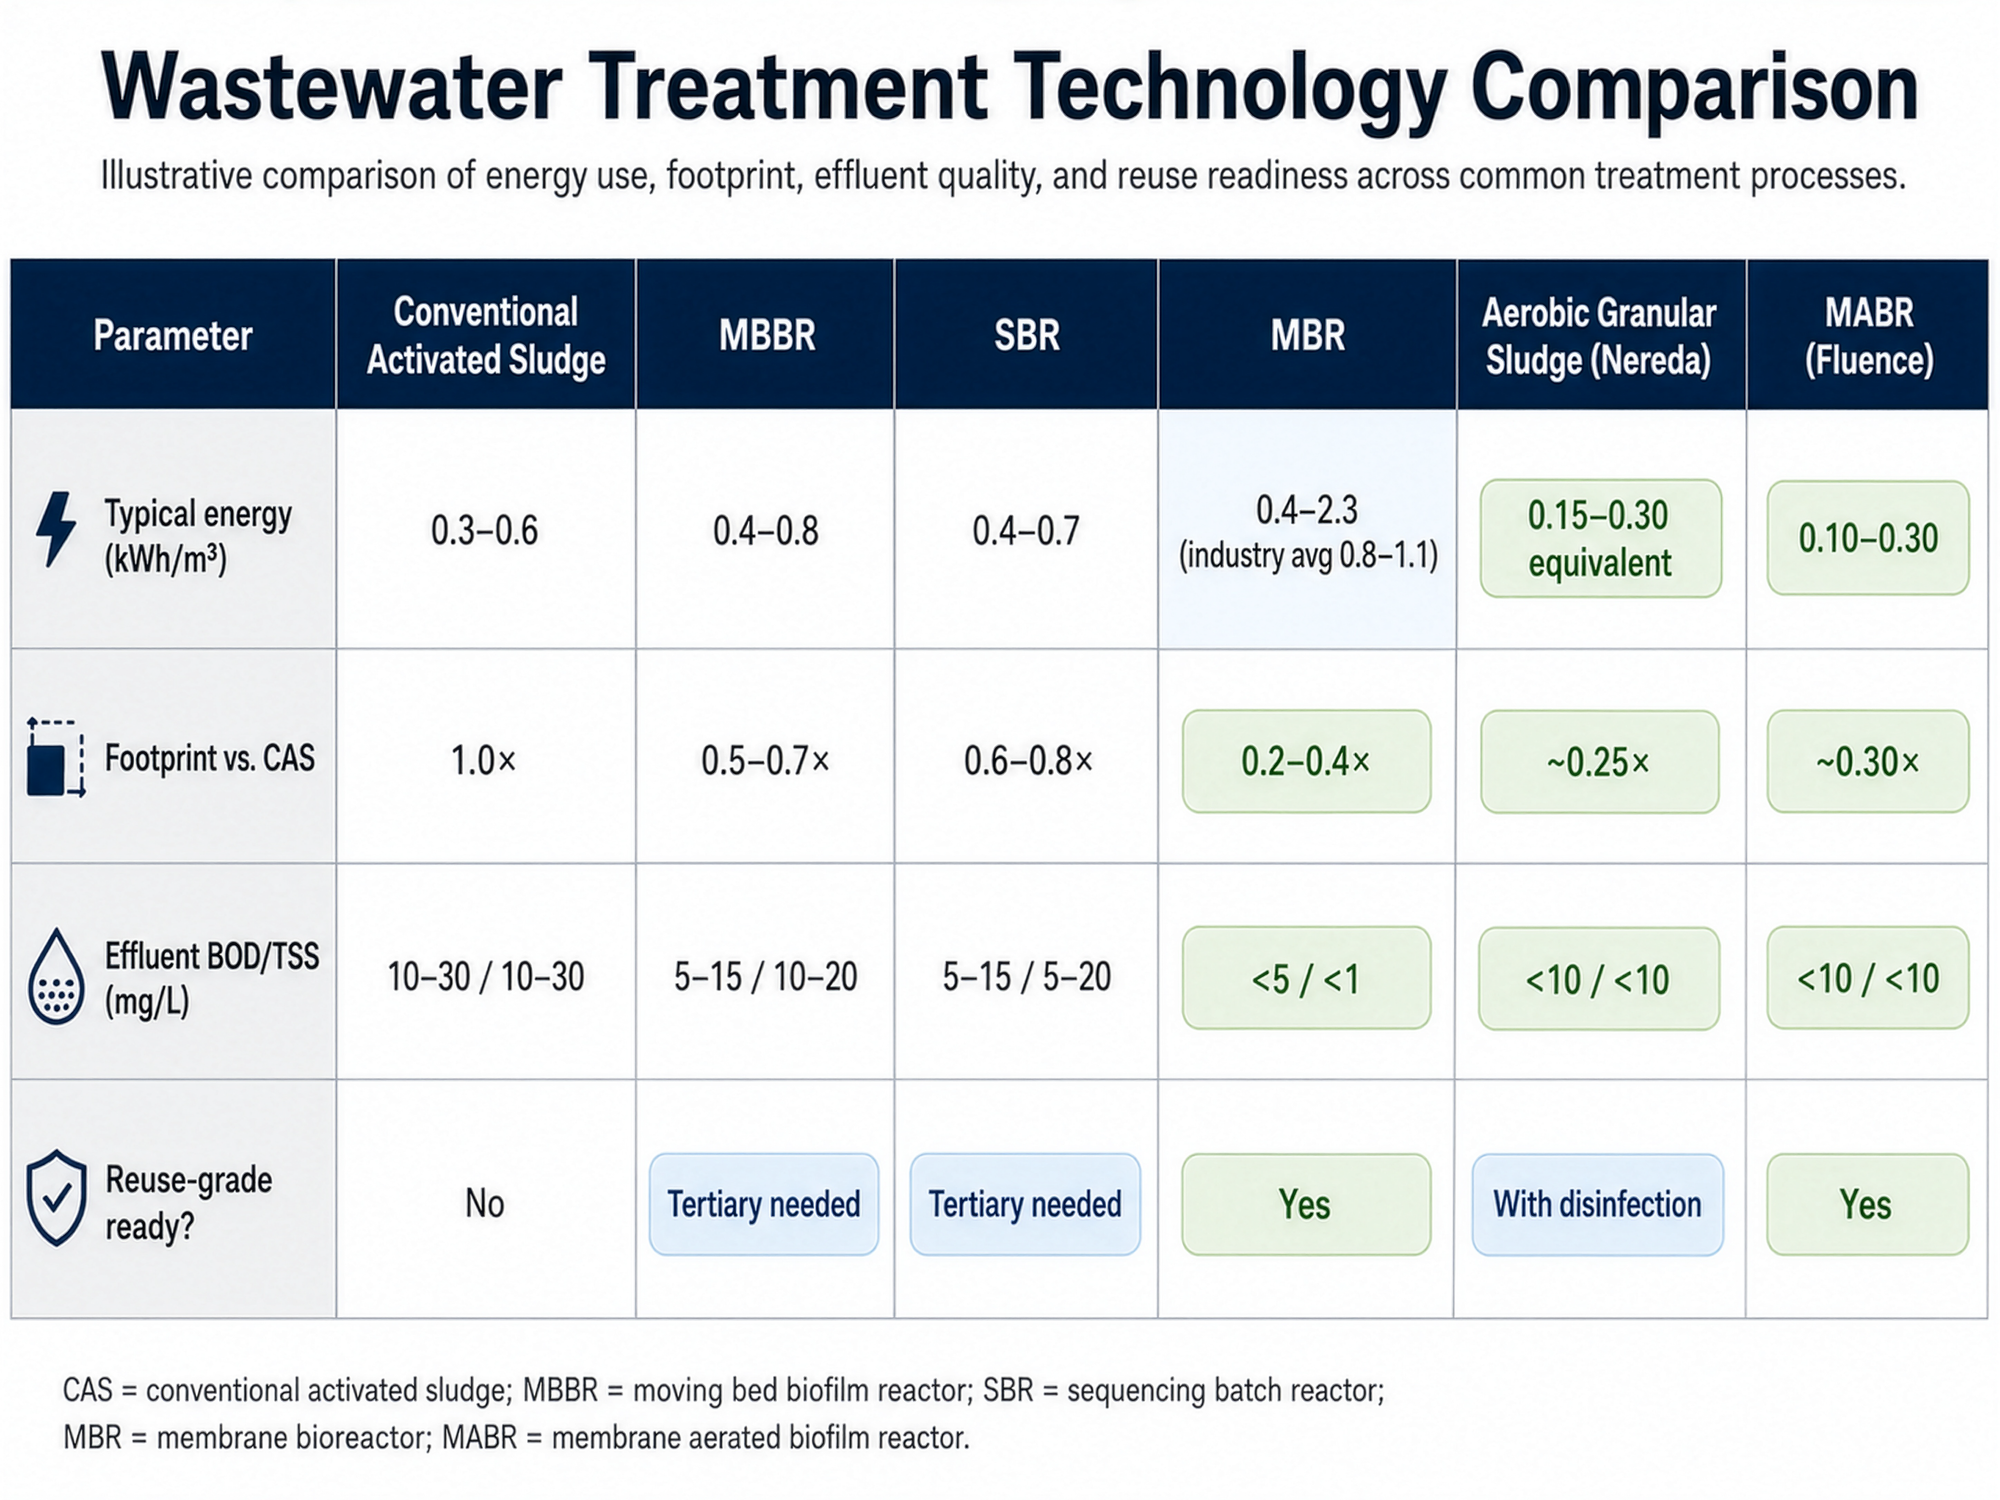
Comparative footprint, energy, and effluent.
| Parameter | Conventional Activated Sludge | MBBR | SBR | MBR | Aerobic Granular Sludge (Nereda) | MABR (Fluence) |
|---|---|---|---|---|---|---|
| Typical energy (kWh/m³) | 0.3–0.6 | 0.4–0.8 | 0.4–0.7 | 0.4–2.3 (industry avg 0.8–1.1) | 0.15–0.30 equivalent | 0.10–0.30 |
| Footprint vs. CAS | 1.0x | 0.5–0.7x | 0.6–0.8x | 0.2–0.4x | ~0.25x | ~0.30x |
| Effluent BOD/TSS (mg/L) | 10–30 / 10–30 | 5–15 / 10–20 | 5–15 / 5–20 | <5 / <1 | <10 / <10 | <10 / <10 |
| Reuse-grade ready? | No | Tertiary needed | Tertiary needed | Yes | With disinfection | Yes |
Sludge handling, monitoring, lifespan. Containerized systems are designed for remote SCADA monitoring (smartphone/tablet control in Aspiral, Newterra Clear3, Veolia CISPEO platforms). Membrane lifespan is typically 7–10 years for hollow fiber MBR (with energy-efficient designs reducing operational costs 12–15% over recent product generations per Market Growth Reports 2024); cleaning chemical costs can consume up to 25% of OPEX per Mordor Intelligence. Containers themselves have a 25-year structural lifespan with refurbishment.
Effluent quality standards and reuse. NSF/ANSI 350-2022 establishes minimum material, design, construction, and performance requirements for onsite residential and commercial water reuse systems (including turbidity and E. coli benchmarks beyond NSF/ANSI 40 and 245); the standard is referenced in the International Plumbing Code and Uniform Plumbing Code. California Title 22 defines four classes: disinfected tertiary recycled water (7-day median total coliform ≤2.2 MPN/100 mL, turbidity ≤2 NTU, 5-log virus reduction) is required for most non-potable urban reuse including landscape irrigation, toilet flushing, and dual-plumbed residential systems.
2. Drivers and Context
Housing. UN-Habitat's 2024 Annual Report (Adequate Housing for All) and 2024 World Cities Report document that more than 1.1 billion people live in slums or informal settlements with an additional ~300 million homeless. In Africa, 62% of urban dwellings are informal; in Asia-Pacific, over 500 million lack basic water service and more than a billion lack adequate sanitation. In many high-demand housing markets, residential expansion is constrained not only by land, financing, labor, zoning, and permitting, but also by utility-servicing capacity, including water, sewer, and wastewater treatment infrastructure. In some regions, sewer capacity, treatment-plant limits, and nutrient-pollution rules can directly delay or block new housing.
US Capacity Concerns. For the U.S., there are clear local examples. Anne Arundel County, Maryland has a sewer-capacity moratorium tied to the Patapsco Wastewater Treatment Plant network. Durham, North Carolina had development in east Durham described as “at a standstill” because the sewer system was at full capacity and upgrades were years away. Brunswick County, NC also saw new construction issues because state accounting rules treated future wastewater from planned homes as already present in capacity calculations. ASCE’s U.S. wastewater infrastructure report also supports the broader context that wastewater systems face aging infrastructure, maintenance needs, capacity pressure, and major capital requirements
Europe Capacity Concerns. For Europe, the clearest current example is the UK/England nutrient neutrality and wastewater capacity problem. UK government materials say water companies will be required to upgrade 160 wastewater treatment works to strict phosphorus limits by 2028, with another 400 upgrades by 2038. There are also specific reported cases, such as an Oxfordshire development of around 1,450 homes that the Environment Agency recommended blocking because of sewage-treatment failures and pollution risk.
Infrastructure backlog. EPA's 2022 Clean Watersheds Needs Survey (April 2024 Report to Congress) reports USD 630 billion in needs over 20 years across wastewater (publicly owned treatment works), stormwater, nonpoint source control, and decentralized wastewater, a 73% increase over 2012. EPA's parallel 2023 Drinking Water Infrastructure Needs Survey and Assessment identified USD 625 billion in needs. ASCE's 2025 Report Card maintained drinking water at C−, wastewater at D+, and stormwater at D, with a quantified USD 99 billion annual wastewater/stormwater capital need against only ~30% currently funded, projecting a USD 690 billion funding gap by 2044. The Bipartisan Infrastructure Law's USD 50 billion water allocation (USD 11.7 billion to the Clean Water State Revolving Fund) is meaningful but insufficient.
Globally, the World Bank Group estimates that achieving SDG 6 by 2030 requires annual investment of approximately USD 410 billion per year (an increase of USD 150 billion per year over current levels), with total investment of USD 1.7 trillion over 15 years per IFC analysis. Universal access to safely managed sanitation by 2030 requires acceleration of six-fold globally and 23-fold in Africa.
Climate stress. World Resources Institute Aqueduct 4.0 (Kuzma et al. 2023, WRI Insights, August 16) finds that 25 countries housing one-quarter of the world's population face extremely high water stress, 50% of the population live under highly water-stressed conditions for at least one month a year, and the global urban population facing water scarcity is projected to double from 930 million in 2016 to 1.7–2.4 billion by 2050 (UNESCO/UN-Water World Water Development Report 2023). The World Economic Forum's Global Risks Report 2024 places environmental risks at the top of the global risk landscape across short, medium, and long horizons.
Historical evolution. Containerized treatment originated in defense, mining, and disaster-relief applications (US military Reverse Osmosis Water Purification Units; UNHCR camp deployments documented in Ab Gadam, Chad and Bidibidi, Uganda). The transition to permanent residential application has accelerated since approximately 2015 with MBR cost reductions, the emergence of MABR and packaged AGS at small scale, and the rise of WaaS contracting.
3. Key Players and Stakeholders
Major equipment integrators and OEMs. Veolia (France, including the former Suez Water Technologies acquired 2022; serves WaaS clients globally); Xylem (US, which announced the acquisition of Evoqua on January 22, 2023 and completed it on May 24, 2023 in an all-stock transaction valued at approximately USD 7.5 billion; the combined company has USD 7.3 billion in pro forma revenue and more than 22,000 employees and is described in Xylem's SEC Form 8-K as "the world's largest pure-play water technology company"); SUEZ (France, the unit now part of Veolia, with separate Suez Water Technologies & Solutions retained by certain prior owners); Kubota Corporation (Japan, flat-sheet MBR); Toray Industries (Japan, hollow-fiber MBR and RO); Mitsubishi Chemical (Japan); Koch Separation Solutions (US); ALFA LAVAL (Sweden); Aquatech International (US); WABAG (India/Europe); Organica Water (Hungary, biofilm "botanical garden" plants; commissioned three plants in Prayagraj, Uttar Pradesh before Maha Kumbh 2025 per Grand View Research).
Specialized containerized/packaged vendors. Fluence Corporation (Australia/US, Aspiral MABR and SUBRE retrofit); Newterra (Canada, Clear3 MBR, see Talbotville, Ontario case study for 500 m³/day expandable to 1,200 m³/day serving an initial 500-home community with 2,000 additional homes planned, replacing a CAD 10 million conventional alternative; Telluride, Colorado mountain-community plant winning the AAEES Grand Prize 2024; western North Dakota oil-patch deployment delivered in 11 ISO containers and installed in two days); AUC Group (US, primarily Texas; package plants 10,000–1,000,000 GPD and concentric circle plants 100,000–2,000,000 GPD, with 2,000+ installations and TCEQ MBR approval typically in five months versus 12–18 for traditional); Seven Seas Water Group (US, Water-as-a-Service with 98.7% uptime claim); BioMicrobics (US, small-scale residential); Smith & Loveless (US, factory built treatment); Aqua-Aerobic Systems (US, exclusive North American Nereda licensee); Royal HaskoningDHV (Netherlands, Nereda technology owner); Centurion (operating in Australia, MBR for Talison Lithium Greenbushes workforce camp expansion +95 kL/d to Class A+ reuse); MAK Water (Australia, containerized BWRO + MBBR sewage plant for the Salt Lake Potash sulphate-of-potash 350-room workforce village commissioned 2021; Bozshakol Copper Project workforce camp in Kazakhstan).
Membrane suppliers. DuPont, Toray, LG Chem, Hydranautics/Nitto Denko, Suez/Veolia, Koch, Vontron (China). MarketsandMarkets identifies the top five membrane manufacturers as collectively holding 35–40% of the market: DuPont, Toray, Hydranautics, Kovalus Separation Solutions, and Pall Corporation. The Toray Membrane Middle East USD 266 million joint venture in Dammam Third Industrial City (Saudi Arabia), with Abunayyan Holding, was inaugurated in November 2025 with a production capacity of 300,000 RO membranes annually covering all manufacturing stages, per Zawya, Smart Water Magazine, and Saudi Water Authority releases.
EPCs, developers, and operators. Master-planned community developers (Texas, Arizona, Florida, Colorado); HOAs that retain WaaS providers; remote camps operated by mining majors (KAZ Minerals, Talison Lithium, Australian iron ore and lithium producers); residential utility districts; private water utilities (American Water).
Regulators. US EPA (Office of Water, decentralized wastewater program); state environmental agencies (TCEQ, CalEPA Regional Water Quality Control Boards, ADEQ, FDEP); local health departments; NSF International (NSF/ANSI 40, 245, 350); plumbing code bodies (IAPMO, ICC); European Commission DG Environment; PUB Singapore; Australia's state EPAs; India's CPCB.
4. Economic and Market Dynamics
Capital cost structure. US wastewater plant construction generally falls in the range of USD 3–15 million per MGD (USD 500–2,500 per GPD), with small-system economies-of-scale penalties. A 0.5 MGD package plant for a rural community typically costs USD 4–8 million; a 50 MGD regional plant achieves much lower per-unit cost. Modular package plants for small towns are commonly USD 300,000–USD 800,000 for systems below approximately 100,000 GPD. MBR carries a 20–40% capital premium over conventional activated sludge but reduces footprint, secondary treatment requirements, and unlocks reuse markets. AUC Group's Harris County, Texas residential project example: the lowest bid for a 600,000 GPD conventional plant was USD 8 million; the developer used a lease-plant arrangement instead.
Operating cost structure. Energy is typically 53% of OPEX for MBR (aeration dominant); chemicals, labor, sludge disposal, and membrane replacement comprise the balance. Membrane fouling-related cleaning chemical costs can absorb up to 25% of OPEX in fouling-prone applications. Skilled operator requirements are higher for MBR than for SBR/MBBR, which can be a binding constraint in remote sites, partly resolved by remote SCADA and WaaS service contracts.
Total cost of ownership comparisons.
• Centralized connection. Where centralized sewers can reach the site within development project economics (typically <2–3 miles, project-dependent), centralized connection remains the lowest lifecycle cost. Beyond that distance, force-main and pump-station capex tilts the economics toward decentralized.
• Septic and onsite systems. Conventional septic costs USD 5,000–30,000 per single home but has limited lot-density support (typically <2 units/acre), poor performance on nutrient removal, and rising maintenance burden. NSF/ANSI 40-certified aerobic treatment units extend this envelope modestly.
• Containerized package plants. Capex sits between centralized and septic on a per-home basis at moderate densities (50–500 homes), with payback driven primarily by avoided sewer-extension costs and time-to-revenue acceleration for the developer.
Market sizing, the spread is large.
| Source (Publication Year) | Market / Segment | Baseline Estimate | Projected Estimate | CAGR | Notes |
|---|---|---|---|---|---|
| Grand View Research (2024) | Global packaged wastewater | USD 28.89 bn (2024) | USD 60.42 bn (2033) | 8.8% | — |
| Grand View Research (2024) | US packaged wastewater | USD 6.33 bn (2024) | USD 6.72 bn (2025), with growth to 2033 | 8.6% | US |
| Grand View Research (2024) | Global membrane bioreactor | USD 3.8 bn (2024) | USD 5.77 bn (2030) | 7.4% | — |
| MarketsandMarkets (2024) | Global membrane bioreactor | USD 4.15 bn (2024) | USD 6.75 bn (2030) | 8.5% | — |
| Verified Market Research (2024) | Global MBR | USD 3.97 bn (2024) | USD 7.39 bn (2032) | 8.9% | — |
| Market.us (2024) | Global MBR | USD 3.8 bn (2024) | USD 8.2 bn (2034) | 8.0% | — |
| Mordor Intelligence (2024) | Global water/wastewater technologies | USD 61.46 bn (2024) to USD 65.15 bn (2025) | USD 85.28–87.60 bn (2029–2030) | 6.10% to 6%+ | — |
| Mordor Intelligence (2025) | Global membrane water and wastewater | USD 6.47 bn (2025) | USD 9.16 bn (2030) | 7.20% | — |
| Mordor Intelligence (2025) | Global industrial wastewater equipment | USD 12.23 bn (2025) | USD 18.70 bn (2030) | 8.86% | — |
| MarketsandMarkets (2021 view) | Global MBR | — | USD 4.9 bn (2026) | 8.3% | Older view |
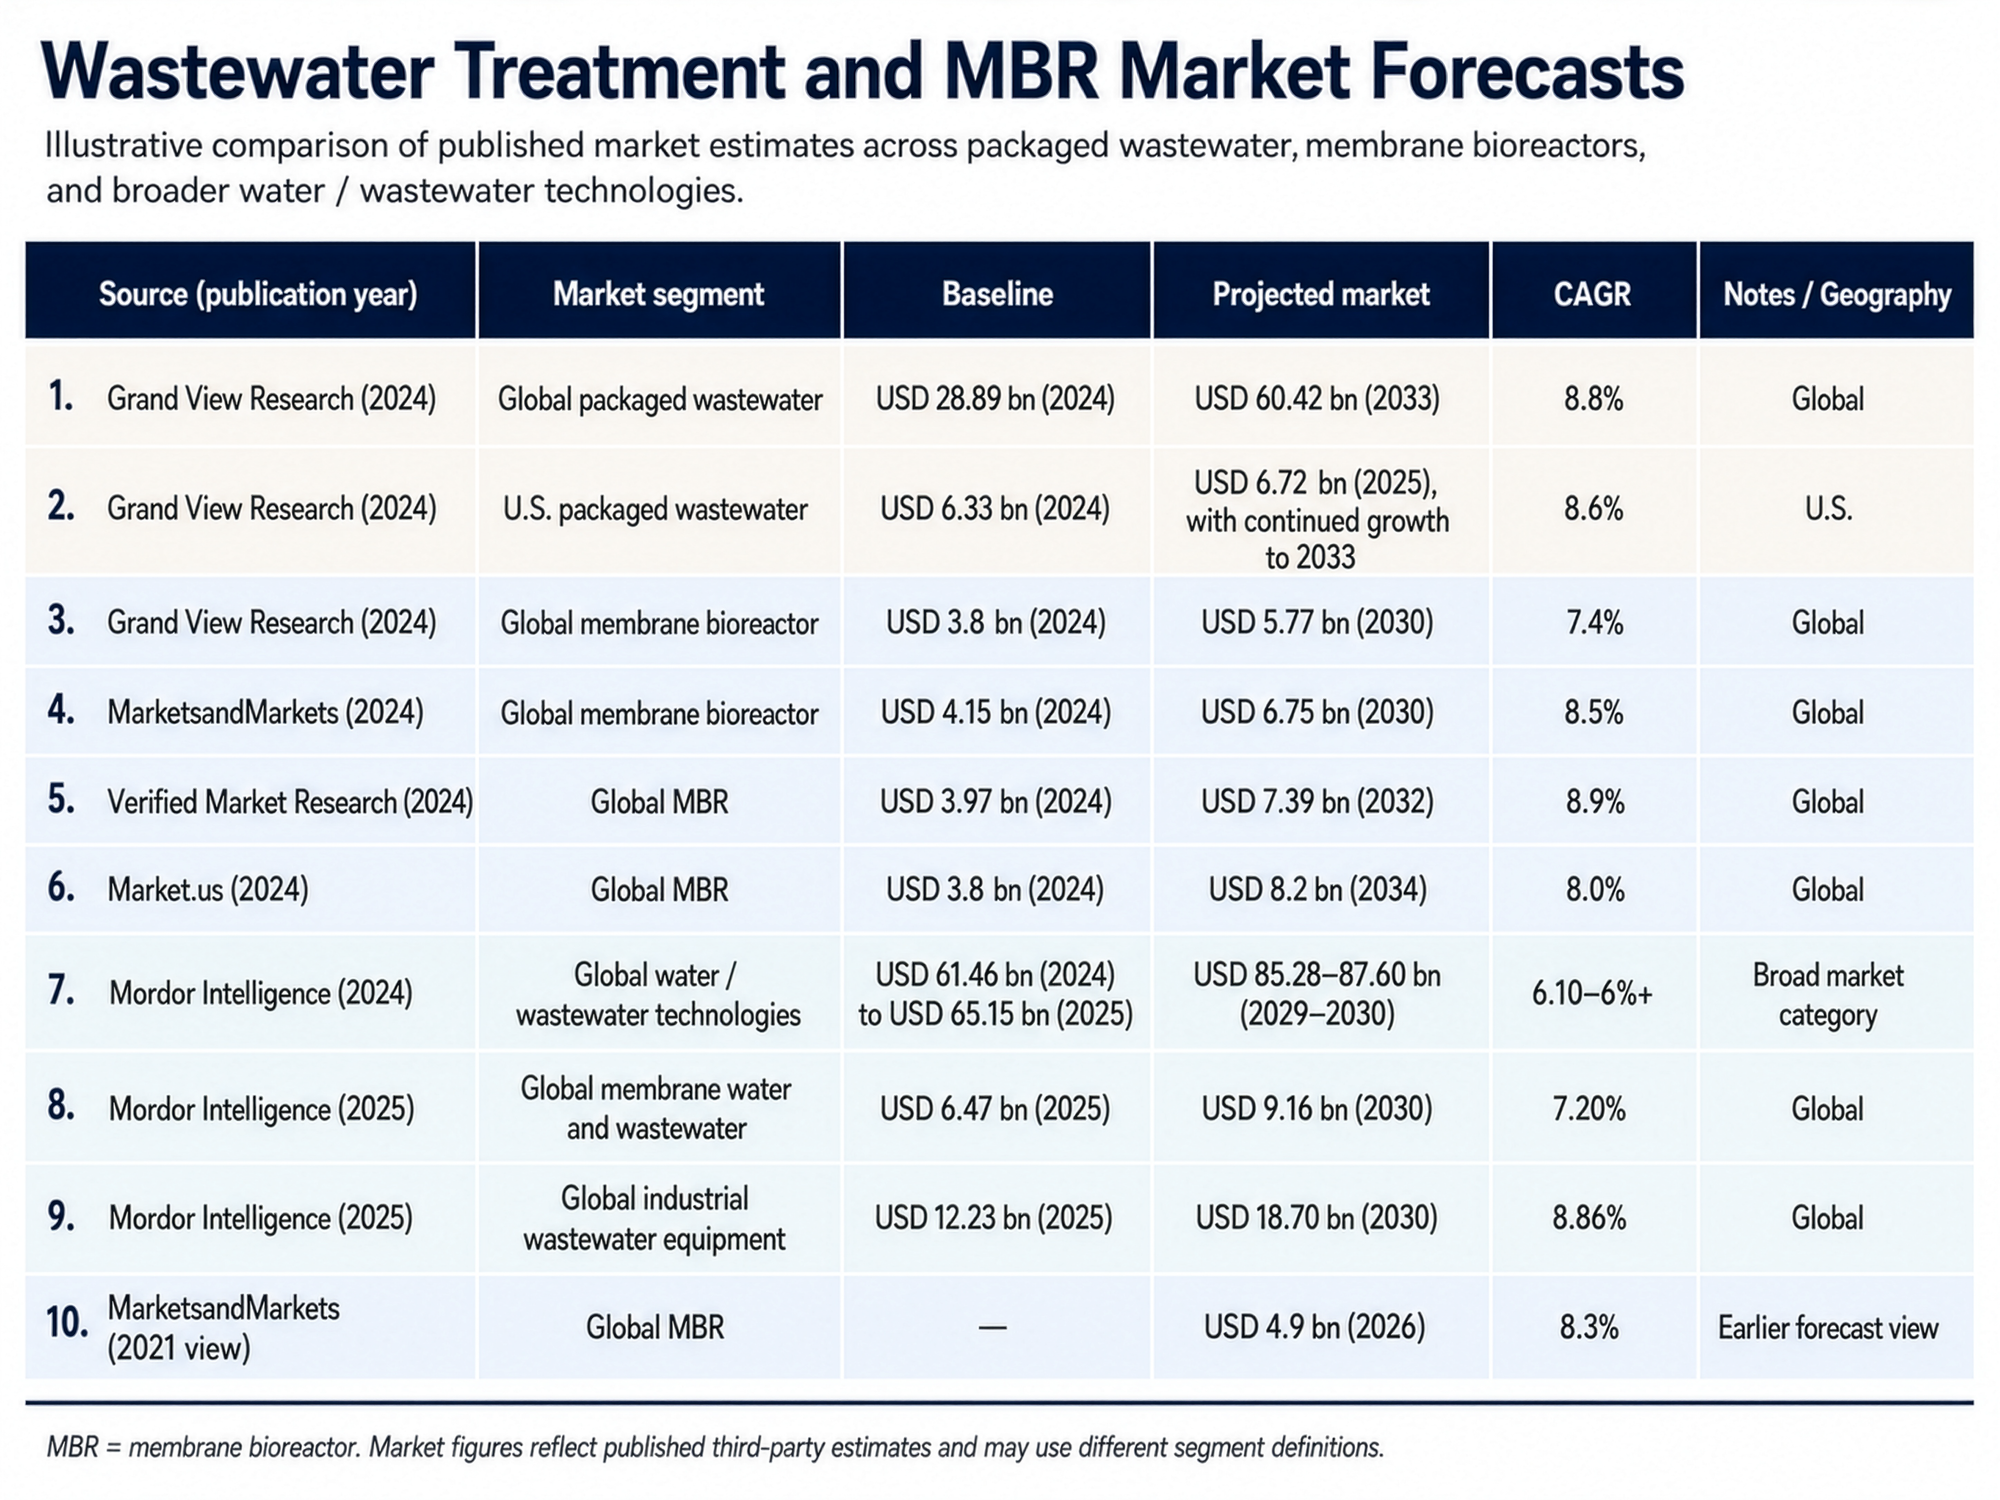
Definitional inconsistencies driving the spread: (i) some market researchers count installed value, others equipment-only; (ii) WaaS recurring revenue is variably included; (iii) MBR boundaries vary between municipal-only and municipal-plus-industrial; (iv) "packaged" is sometimes defined as <1 MGD, sometimes <10 MGD.
Financing and ownership models.
• Developer-owned with municipal eventual takeover. Common in US master-planned communities; risk on long-tail O&M sits with developer until handoff.
• Utility-owned with extension fee. Where capacity-available utilities exist.
• Build-Own-Operate-Transfer (BOOT) and Build-Own-Operate (BOO). Private operator carries capex and operating risk; predominant model for AUC Group lease plants and Seven Seas Water Group WaaS.
• Water-as-a-Service (WaaS). Subscription pricing (Veolia, Seven Seas, Ekopak) pricing typically USD 4–12 per 1,000 gallons treated depending on volume and reuse premium. Ekopak claims 30–40% reduction in average water cost via WaaS contracts.
5. Regulatory Landscape
United States. No single federal pathway governs decentralized residential treatment. EPA's Decentralized Wastewater Management Program provides voluntary guidance under the Memorandum of Understanding among 14 federal agencies. Effluent discharge permitting flows through state NPDES authorities for surface-water discharge or state-level land application/reuse regulations for non-discharge facilities
• California Title 22 (Code of Regulations, Division 4, Chapter 3). Defines disinfected tertiary recycled water (≤2.2 MPN/100 mL total coliform, ≤2 NTU turbidity, 5-log virus reduction) and disinfected secondary 2.2 and 23 grades; permits 40 specific tertiary uses. Direct Potable Reuse regulations took effect October 1, 2024.
• Texas. TCEQ permits MBR installations within 150 feet of property lines (vs. 500+ for conventional plants), and AUC Group reports MBR approvals in five months vs. 12–18 for conventional.
• Arizona. ADEQ governs reclaimed water under R18-11 and 18-9 rules.
• Florida. FDEP has the most mature US reuse framework; the state reuses the largest share of municipal wastewater of any US state.
NSF/ANSI standards.
• NSF/ANSI 40: residential wastewater treatment systems.
• NSF/ANSI 245: residential nitrogen reduction.
• NSF/ANSI 350-2022: onsite residential and commercial water reuse (combined wastewater up to 5,678 L/day; commercial above that capacity). Referenced in International Plumbing Code and Uniform Plumbing Code.
European Union. Regulation (EU) 2020/741 on minimum requirements for water reuse, in force 5 June 2020 and applicable from 26 June 2023, establishes four reclaimed water classes (A–D) for agricultural irrigation with EU-wide minimum quality (E. coli, BOD₅, TSS, turbidity for Class A) and risk-management requirements. Class A requires secondary treatment plus filtration plus disinfection; lower classes need secondary plus disinfection. As of pre-regulation baseline, only ~2% of treated wastewater in Europe was reused against ~6,000 million m³/year technical potential. A 2024 Delegated Regulation specifies risk-management technical specifications.
Urban Wastewater Treatment Directive recast (2024). The recast UWWTD raises ambition with quaternary (micropollutant) treatment requirements for plants serving >100,000 population equivalent, accelerating MBR retrofit demand.
Singapore. PUB's NEWater meets approximately 40% of national water demand (capacity ~760,000 m³/day) via MF/UF + RO + UV, with the upcoming Tuas NEWater Factory scaling from 25 to 75 MGD by 2035. PUB integrated MBR at Changi from 2006; the Tuas WRP will house the world's largest ceramic MBR system at industrial scale.
Australia. State EPAs and Australian Drinking Water Guidelines (NHMRC/NRMMC 2011 + updates); Class A+ reuse is the highest classification, used by Talison Lithium for dust suppression and process water at the Greenbushes mine workforce camp expansion.
India. Central Pollution Control Board sets effluent standards; the building-code-mandated on site greywater recycling in major Indian cities is now driving MBR adoption in hospitality and commercial real estate (Mordor Intelligence 2026, India market USD 3.3 bn projected to USD 5 bn by 2031).
Middle East. Saudi Arabia and UAE deploy decentralized systems aggressively for both desalination feed and reuse; the Saudi Water Conversion Corporation's 2030 vision targets 90% wastewater reuse.
Regulatory friction constraining adoption. (i) Permit timelines varying from months to years; (ii) absence of clear decentralized-system performance-equivalence with centralized for fire flow and rate-base calculations; (iii) bonding and surety requirements that ignore modular replaceability; (iv) inconsistent treatment under utility tariff frameworks; (v) public-perception gaps regarding "toilet-to-tap" reuse.
6. Geopolitical and Strategic Dimensions
Water security. The US Intelligence Community Assessment Global Water Security (ICA 2012 08, Defense Intelligence Agency lead drafter, February 2012) concluded that "during the next 10 years, many countries important to the United States will experience water problems (shortages, poor water quality, or floods) that will risk instability and state failure." The assessment's framing remains broadly authoritative within US national-security circles. Subsequent updates by ODNI and DOD have reinforced these conclusions.
Strategic supply-chain considerations. Reverse-osmosis and ultrafiltration membranes, irreplaceable in MBR, MABR, and downstream reuse polishing, are produced by a small set of companies concentrated in the US, Japan, South Korea, France, and China. Vontron (China) holds approximately 45% of China's industrial RO market (Chemical Research Insight 2025); North America retains roughly 43% of global RO demand (Coherent Market Insights 2024) but a thinner share of upstream manufacturing. Hydranautics is owned by Japan's Nitto Denko Group, despite Oceanside, California headquarters and US manufacturing. The Toray Membrane Middle East USD 266 million JV plant in Dammam (300,000 membranes/year, inaugurated November 2025) is one of multiple efforts to localize membrane production in the Middle East. Tariff exposure, sanctions risk, and currency volatility all create supply-chain risk for US-based developers relying on imported membranes.
Resilience and disaster recovery. The 2017 Hurricane Maria event in Puerto Rico left 43% of wastewater treatment plants inoperable and more than 95% of Puerto Ricans without drinking water, per RAND Homeland Security Operational Analysis Center reports RR2595 and RR2608 (both FEMA-sponsored); the GAO reported approximately USD 32.5 billion in FEMA-awarded recovery funding by August 2022 (GAO-22-106211), of which about USD 1 billion went to permanent infrastructure rebuilding. Containerized treatment plays a triple resilience role: (i) rapid post-disaster deployment to restore service while centralized assets are repaired; (ii) baseline resilience for outlying communities that would otherwise have been the lowest priority for restoration; (iii) hedging against centralized single-point-of-failure risk. UNHCR has used containerized/mobile treatment in refugee settings in Iraq, Rwanda, Tanzania, Kenya, Uganda (Bidibidi), Chad (Ab Gadam), and Bangladesh (Kutupalong/Cox's Bazar), winning a €1 million European Innovation Prize in 2022.
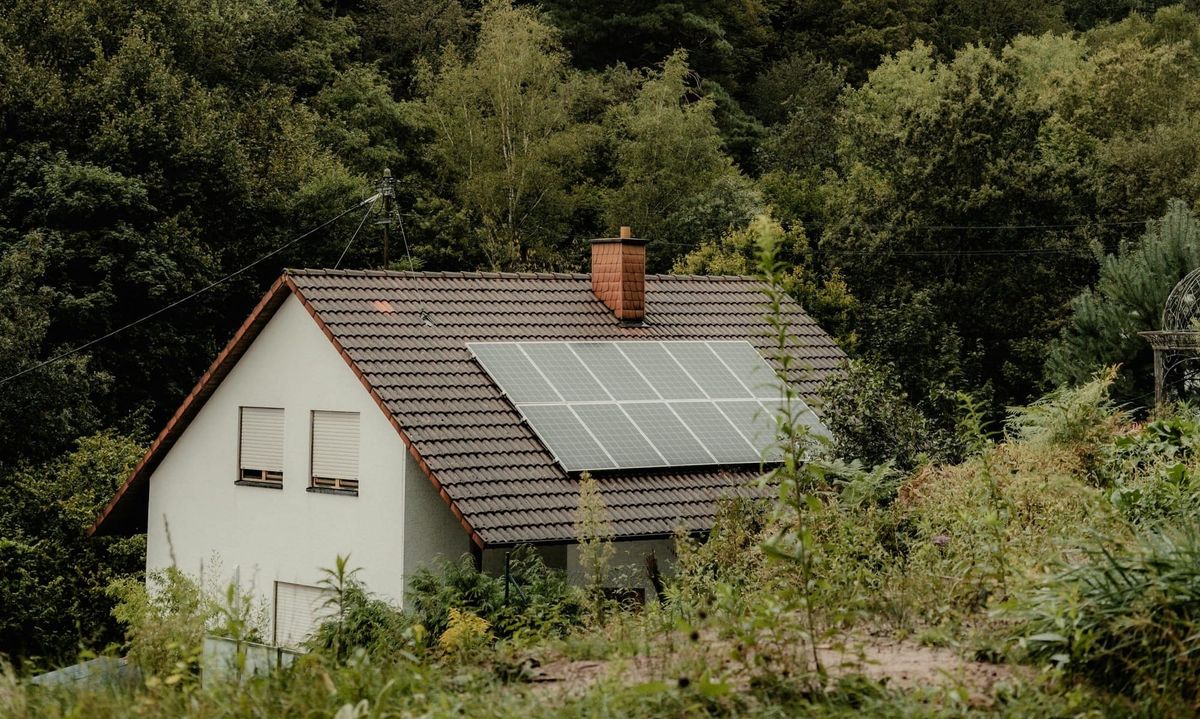
Implications for water-stressed and rapidly urbanizing regions. WRI Aqueduct 4.0 projects that 31% of global GDP — USD 70 trillion — will be exposed to high water stress by 2050, with India, Mexico, Egypt, and Turkey accounting for over half of exposed GDP. By 2050, an additional 1 billion people are expected to live with extremely high water stress. Decentralized treatment with reuse is decision-relevant infrastructure in these regions because it (i) shortens delivery timelines, (ii) recycles water locally rather than rejecting treated effluent to distant water bodies, (iii) can integrate with solar power for off-grid operation, and (iv) avoids dependence on long haul sewer infrastructure that is itself climate-vulnerable.
Positioning within development policy. The World Bank Group's water portfolio (IFC USD 7.2 billion since 1995) increasingly explicitly funds decentralized and modular delivery models, and SDG 6 financing dialogues now formally treat containerized/decentralized systems as a complementary pathway rather than an inferior interim solution.
7. Risk Factors
Technical risks. Membrane fouling and replacement (largest single OPEX swing factor — up to 25% of OPEX in problem applications); biological upset from shock loads (lower for MBBR/SBR, moderate for MBR, low for AGS); cold-weather performance in unenclosed or poorly insulated containers; operator skill availability in remote locations (mitigated by remote SCADA and WaaS service contracts); sludge handling logistics; integration with reuse end-uses (irrigation pumps, dual plumbing).
Regulatory risks. Permitting timeline overruns; mid-project effluent standard tightening (e.g., emerging contaminants PFAS, micropollutants); changing reuse classification; jurisdictional ambiguity between state/local; lack of takeover pathways for developer-owned plants when municipal utility eventually extends service.
Financial risks. Mid-project cost overruns in concrete site work (often 15–40% of total cost); membrane price volatility; energy cost exposure (53% of OPEX for MBR); insufficient O&M reserves leading to deferred maintenance; long-term residual value uncertainty for containerized assets; counterparty risk for WaaS providers.
Adoption risks. Developer/buyer skepticism about "package" plant durability; HOA capacity to govern utility decisions over multi-decade horizons; political risk in jurisdictions where decentralized solutions threaten established utility ratemaking; competition from septic/onsite alternatives in jurisdictions with permissive lot-density rules.
Risk evolution over time. Technical risk is declining as membrane technology matures, AGS gains track record, and SCADA reduces operator dependency. Regulatory risk is rising in the short term (PFAS, micropollutants, climate adaptation) but plateauing in the medium term as harmonized frameworks (EU 2020/741, NSF/ANSI 350) gain traction. Financial risk is declining as WaaS providers absorb developer-side capex risk. Adoption risk is declining as visible successful deployments (Talbotville, Fort Pierce, Telluride, Singapore NEWater) accumulate.
Recommendations
For greenfield residential developers (and master-planned community sponsors):
- Default to a containerized/skid-mounted package plant evaluation any time centralized connection is delayed by more than 24 months or requires more than 2 miles of force main. Run an explicit time-to-revenue accelerator NPV against carrying cost of land and lost absorption velocity.
- Prefer WaaS or BOOT financing for projects below 1 MGD. AUC Group, Seven Seas Water Group, Veolia, and Newterra all offer turnkey models that eliminate developer capex and operator-skill burden; the implicit interest cost is more than offset by accelerated absorption.
- Specify NSF/ANSI 350 certification for any plant that may eventually serve reuse end uses (even if initial deployment is discharge-only) to preserve optionality. Confirm Title 22 (California), Class A+ (Australia), or EU 2020/741 Class A equivalence in the procurement specification.
- Build a takeover protocol into the original utility agreement. The single most common failure mode of developer-owned plants is HOA governance fatigue over a 20–30 year horizon; pre-negotiating municipal takeover pricing (e.g., depreciated replacement value plus working capital) at project entitlement avoids the worst outcomes.
For utilities and municipalities considering decentralized as an extension of the centralized portfolio:
- Pre-qualify two or three integrators on framework contracts to enable rapid deployment during capacity squeeze periods. Use the Talbotville (Newterra) and Fort Pierce (AquaNereda) deployment timelines as benchmarks (under 2 weeks for the former, full commissioning in months for the latter). 6. Maintain a hot-standby containerized unit for disaster-recovery purposes. Cost: roughly 1–3% of total capex of the centralized portfolio for the largest population concentration served.
For regulators:
- Adopt NSF/ANSI 350 by reference in plumbing codes and reuse permitting, as Washington State has done. This collapses the compliance burden onto product certification and accelerates approvals from months to days.
- Harmonize state-level decentralized treatment performance equivalence with centralized for fire-flow, density, and rate-base purposes. The single largest regulatory friction is not effluent quality (technology is solved) but treatment of decentralized as second-class in entitlement frameworks.
For investors and infrastructure funds:
- Treat WaaS contract portfolios as utility-like cashflow streams with regulatory risk closer to mid-stream energy than to traditional municipal utility. The recurring-revenue WaaS market is the most under-priced corner of the broader water market.
Benchmarks that would change these recommendations:
• A reduction in centralized connection wait times to <12 months in major US growth markets would weaken recommendation 1.
• A federal preemption of state decentralized rules under EPA (unlikely on a 5-year horizon) would weaken recommendation 4.
• A consolidation event in the membrane supply chain that left fewer than three suppliers controlling >75% of TFC RO production would warrant a defensive procurement strategy.
• A reuse-related public-health incident attributable to a packaged plant could set back regulatory progress by 5–10 years
Caveats
- Market-size figures vary substantially across research firms. The 2× spread between Grand View Research and Mordor Intelligence on broadly similar definitions reflects scope/boundary differences rather than analytical disagreement; readers should treat any single market-size figure as directional.
- Vendor case-study data are vendor-published and not independently audited. Newterra's Talbotville, Fort Pierce, Telluride, and AUC Group's Harris County cost figures are credible but should be triangulated against utility filings for high-stakes decisions.
- Energy consumption figures for MBR span almost an order of magnitude (0.4–2.3 kWh/m³), site-specific design, operating regime, and influent characteristics drive most of the variance.
- The "containerized = better" framing is not universal. Where economies of scale are achievable and centralized connection timelines are tolerable, centralized treatment remains lower lifecycle cost.
- Peer-reviewed full-scale data for MABR and packaged AGS are still thinner than for MBR/MBBR/SBR. Investors and engineers should weight vendor performance claims accordingly.
- Public perception risk for residential reuse, particularly potable reuse, remains uneven across jurisdictions and can shift abruptly with media incidents.
- Regulatory frameworks are mid-cycle. The EU Urban Wastewater Treatment Directive recast (2024), California Direct Potable Reuse regulations (effective October 2024), and emerging US PFAS rules will reshape the operating environment over the next 3–5 years.
- Geopolitical assumptions about membrane supply chains are necessarily directional given limited published data on production-volume shares (as opposed to demand-side market shares); the figures cited reflect the best public information available but should be triangulated with primary supplier disclosures for procurement decisions.


Citations:
Anne Arundel County Government. (2026, June 3). Sewer capacity moratorium: Information & updates. https://www.aacounty.org/SewerCapacityMoratorium
Casey, M. (2026, March 5). ‘Five-year solution does not work’: Developers share concerns with Durham sewage capacity issues. WRAL. https://www.wral.com/news/local/east-durham-development-stalled-sewer-capacity-goose-creek-march-2026/
Smith, C. (2026, March 2). Brunswick County sewer capacity issues halt new construction. WECT. https://www.wect.com/2026/03/02/brunswick-county-sewer-capacity-issues-halt-new-construction/
American Society of Civil Engineers. (2025). Wastewater. 2025 Infrastructure Report Card. https://infrastructurereportcard.org/cat-item/wastewater-infrastructure/
Department for Environment, Food & Rural Affairs. (2023, June 28). Nutrient pollution: Reducing the impact on protected sites. GOV.UK. https://www.gov.uk/government/publications/nutrient-pollution-reducing-the-impact-on-protected-sites/nutrient-pollution-reducing-the-impact-on-protected-sites
Laville, S. (2024, February 27). Oxfordshire housing development ‘should be blocked due to failing sewage system’. The Guardian. https://www.theguardian.com/environment/2024/feb/27/oxfordshire-housing-development-should-be-blocked-due-to-failing-sewage-system
American Society of Civil Engineers. (2025). Drinking water, wastewater & stormwater. 2025 Infrastructure Report Card. https://infrastructurereportcard.org/cat-item/iija-drinking-water-wastewater-stormwater/
ANSI. (2018). NSF/ANSI 350-2018: Onsite residential and commercial water reuse treatment systems. https://webstore.ansi.org/standards/nsf/nsfansi3502018
ANSI. (2022). NSF/ANSI 350-2022: Onsite residential and commercial water reuse treatment systems. https://webstore.ansi.org/standards/nsf/nsfansi3502022
AUC Group. (n.d.). Water and wastewater treatment for master-planned communities. https://aucgroup.net/master-planned-communities/
Chemical Research Insight. (2025, June 2). Top 10 companies in the reverse osmosis (RO) membrane industry (2024): Market leaders pioneering water purification solutions. https://chemicalresearchinsight.com/2025/06/02/top-10-companies-in-the-reverse-osmosis-ro-membrane-industry-2024-market-leaders-pioneering-water-purification-solutions/
EnterpriseAM. (2025, November 13). Eastern Province launches Toray Membrane factory. https://enterpriseam.com/ksa/2025/11/13/eastern-province-launches-toray-membrane-factory/
Kitanou, S., Ayyoub, H., El-Ghzizel, S., Belhamidi, S., Taky, M., & Elmidaoui, A. (2021). Membrane bioreactor for domestic wastewater treatment: Energetic assessment. Desalination and Water Treatment, 240, 55–62. https://doi.org/10.5004/dwt.2021.27675
Kuzma, S., Saccoccia, L., & Chertock, M. (2023, August 16). 25 countries, housing one-quarter of the population, face extremely high water stress. World Resources Institute. https://www.wri.org/insights/highest-water-stressed-countries
May, L. (2024, March 21). The impact of water quality on master-planned communities: Why treatment matters. AUC Group. https://aucgroup.net/master-planned-community-water-quality/
National Association of Clean Water Agencies. (2024, May 14). EPA Clean Watershed Needs Survey report reinforces importance of additional federal funding for water infrastructure. https://www.nacwa.org/news-publications/news-detail/2024/05/14/epa-clean-watershed-needs-survey-report-reinforces-importance-of-additional-federal-funding-for-water-infrastructure
Newterra. (n.d.). Small municipality wastewater system. https://www.newterra.com/case-study/small-municipality-wastewater-system/
NSF. (n.d.). Water reuse systems certification. https://www.nsf.org/water-systems/onsite-wastewater-water-reuse-systems/water-reuse
Pronk, M., de Kreuk, M. K., de Bruin, B., Kamminga, P., Kleerebezem, R., & van Loosdrecht, M. C. M. (2015). Full scale performance of the aerobic granular sludge process for sewage treatment. Water Research, 84, 207–217. https://doi.org/10.1016/j.watres.2015.07.011
Rahman, T. U., Roy, H., Islam, M. R., Tahmid, M., Fariha, A., Mazumder, A., & Islam, M. S. (2023). The advancement in membrane bioreactor (MBR) technology toward sustainable industrial wastewater management. Membranes, 13(2), Article 181. https://pmc.ncbi.nlm.nih.gov/articles/PMC9965322/
RAND Corporation. (n.d.). Hurricanes Irma and Maria: Impact and aftermath. https://www.rand.org/hsrd/hsoac/projects/puerto-rico-recovery/hurricanes-irma-and-maria.html
Smart Water Magazine. (2025, November 13). Saudi Arabia opens $266 million RO membrane plant. https://smartwatermagazine.com/news/smart-water-magazine/saudi-arabia-opens-266-million-ro-membrane-plant
Umweltbundesamt. (n.d.). EU regulation on minimum requirements for water reuse. https://www.umweltbundesamt.de/en/topics/water/water-resource-management/water-reuse/eu-regulation-on-minimum-requirements-for-water
United Nations News. (2025, May). UN searches for solutions to global housing crisis. https://news.un.org/en/story/2025/05/1163851
U.S. Environmental Protection Agency. (n.d.). Summary of California’s water reuse guideline or regulation for impoundments. https://www.epa.gov/waterreuse/summary-californias-water-reuse-guideline-or-regulation-impoundments
U.S. Environmental Protection Agency. (n.d.). Summary of Singapore’s water reuse guideline or regulation for potable water reuse. https://www.epa.gov/waterreuse/summary-singapores-water-reuse-guideline-or-regulation-potable-water-reuse
Xylem Inc. (2023). Unaudited pro forma condensed combined financial information [Exhibit 99.3]. U.S. Securities and Exchange Commission. https://www.sec.gov/Archives/edgar/data/1524472/000119312523202870/d510680dex993.htm