Can Critical Metals (CRML) Build Tanbreez? A Technical and Economic Audit of Its Greenland Rare Earth Mine and $1.85B Romanian Refinery
Not yet: CRML's >99% result is dissolution, not separation, and silica, niobium and hafnium, not heavy rare earths, carry its $2.2B refinery model.

TL;DR
- Critical Metals Corp. (NASDAQ:CRML) has not demonstrated that it can build the Tanbreez mine-to-metals system as described; the September 2026 refinery figures are a promotional company model attached to a plant that does not exist, a joint venture that is not signed, a mine that is not built, and a concentrate grade not yet produced at scale.
- The greater than 99 percent result measures dissolution of concentrate into solution, not recovery or separation of any element at saleable purity, and the modeled economics are dominated by by-products (silica, niobium, tantalum, hafnium and the zirconium family), not by the separated heavy rare earths the headline emphasizes.
- Several modeled volumes are implausible against the markets they would enter, most acutely 50 to 70 tonnes per year of hafnium metal against a global market privately estimated at roughly 70 to 75 tonnes per year; on current evidence first separated dysprosium, terbium and yttrium from this integrated system is an early-to-mid 2030s proposition at best, if the metallurgy scales at all.
Key Findings
The verdict on the title question is negative on current evidence. Every headline number in the 16 September 2026 refinery study attaches to a facility that has not been engineered to feasibility grade, a Romanian joint venture that remains a non-binding term sheet, a mine that has not been financed or permitted for construction, and a hydrometallurgical flowsheet demonstrated only at bench scale. The chemistry is credible and consistent with two decades of eudialyte research, but the leap from that chemistry to a US$2.2 billion-per-year, 19-product commercial refinery is entirely modeled. The most recent information relied on here is dated 21 September 2026, covering the announced United States-Denmark-Greenland security agreement and the associated CRML share reaction [23].
The three findings that drive the verdict are, first, that dissolution is not recovery and recovery is not separation, so the flagship result does not establish that dysprosium, terbium and yttrium can be produced as individual, magnet-grade products [1][3]; second, that the modeled revenue is dominated by silica and the zirconium-family credits rather than the heavy rare earths, inverting the marketing emphasis [1]; and third, that key product volumes and prices cannot hold simultaneously, because the modeled hafnium output alone would roughly double world supply and collapse the price at which it is valued [1][25]. The single binding commercial arrangement in the entire structure is the REalloys offtake for 15 percent of Phase 1 concentrate; the 50 percent allocated to the Romanian refinery is self-offtake to an entity CRML would half-own, and the US$1.85 billion refinery capital has no identified source [11][12][33].
Details
1. Classification and analytical approach
This is a proposed integrated system with two physical nodes in two jurisdictions joined by a long logistics chain. The first node is the Tanbreez mine and concentrator at Killavaat Alannguat (Kringlerne) in the Kujalleq municipality of southern Greenland, held under exploitation licence MIN 2020-54, granted in 2020 for a 30-year term over 18 square kilometres within the Ilimaussaq intrusive complex [8]. The second is the proposed CRML Romania refinery at the Feldioara uranium-concentrate processing site in Brasov County, owned by the Romanian state through Nuclearelectrica (BVB:SNN) and its wholly owned subsidiary FPCU (Fabrica de Prelucrare a Concentratelor de Uraniu S.R.L.), a state-owned uranium-concentrate processor [10]. The refinery carries the greater analytical weight because the title claims all belong to it and because it is the least mature and least independently documented part of the system.
2. Contextual background
Eudialyte is a complex sodium-calcium zirconosilicate that carries rare earths, zirconium, hafnium, niobium and tantalum within its structure. It is attractive because of a relatively high heavy rare earth share, low radioactivity compared with the monazite and steenstrupine ores of the region, and its zirconium-family credits. The Tanbreez deposit sits in the layered kakortokite of the Ilimaussaq alkaline complex, the same complex that hosts the uranium-rich Kvanefjeld (Kuannersuit) deposit held by Energy Transition Minerals (ASX:ETM) [20].
 John D
No eudialyte deposit has ever been commercialized, for three linked reasons: rare earth grades are low, generally around 1 to 3 percent total rare earth oxides in concentrate and far lower in situ; acid leaching (lixiviation) releases silica that polymerizes into an unfilterable gel, historically defeating hydrometallurgical routes; and the product slate is polymetallic, forcing a developer to separate and sell many materials into many small markets at once. The EU-funded EURARE project studied precisely the Kringlerne and Norra Karr eudialyte resources and produced peer-reviewed routes that suppress silica gel. Davris and colleagues reported that fuming pretreatment with sulfuric or hydrochloric acid followed by water leaching gave greater than 90 percent recovery of rare earths while avoiding silica gel formation, with less than 50 milligrams per litre of silicon achieved in solution [38]. Vossenkaul and colleagues reported a low-temperature dry-digestion route reaching rare earth recovery yields of up to 85.5 percent [39]. This literature is the essential backdrop: overcoming silica gel at bench scale is a solved problem in the academic record, and the company's dissolution claim is best read as a proprietary variant of known chemistry rather than a scientific breakthrough.
The heavy rare earths that matter to the investment case, dysprosium, terbium and yttrium, must be separated from one another and from the light rare earths by solvent extraction or ion exchange, a multistage, capital-intensive and know-how-intensive step. Producing a mixed rare earth chloride or carbonate is comparatively easy; producing individually separated, magnet-grade oxides or metals to 99.9 to 99.99 percent purity at commercial throughput is the hard, value-defining step, and it is the step Western developers most often fail to demonstrate.
3. The asset: corporate, ownership and financial profile
Critical Metals Corp. is the product of a 2024 combination with a vehicle associated with European Lithium Ltd (ASX:EUR). European Lithium remains the largest shareholder, holding 45,536,338 CRML shares, about 31 percent, as of September 15th, 2026 [45], down from 83.03 percent when the 2024 combination completed [46]; press reporting links the structure to Romanian businessman Frank Timis [36]. This related-party architecture is significant: the counterparty to the pending acquisition, the largest shareholder, and the vendor of the out-of-scope Wolfsberg lithium asset are entangled, so a diligent investor should treat CRML governance as promoter-controlled rather than independent.
The Government of Greenland approved on April 17th, 2026, the transfer of a further 50.5 percent interest in Tanbreez Mining Greenland A/S, taking CRML to 92.5 percent, with European Lithium retaining 7.5 percent [12]. CRML has agreed an all-share acquisition of European Lithium under a binding scheme implementation deed, valued at about US$835 million at announcement on 27 April 2026 under an original fixed ratio of 0.035 [47]. The ratio has since been replaced by a collar under which each European Lithium share receives between 0.025 and 0.045 CRML shares, set by CRML's 20-day VWAP between US$8 and US$16 [48]. Securityholder votes are set for 22 October 2026, with completion targeted for November 2026 [37]. The scheme booklet assumes a VWAP of US$6.38, which sets the maximum 0.045 ratio, and puts European Lithium holders at approximately 38.0 percent of the combined group undiluted and 35.2 percent fully diluted [45]. That figure appears to count European Lithium's 45.5 million CRML shares as still on issue. Netting them out, as CRML said in April it intends to do by cancelling them [47], European Lithium holders' effective interest would be roughly 47 percent on this report's arithmetic. The independent expert judged the share scheme not fair but reasonable, valuing the consideration at A$0.4031 per European Lithium share against an assessed control value of A$0.4431, a shortfall of about 9 percent [45]. The transaction would take CRML to 100 percent of Tanbreez by absorbing European Lithium's 7.5 percent interest and would bring the cross-holding inside the group. European Lithium is the original vendor of the Wolfsberg project, which CRML has owned since 2024. The cost is very substantial dilution: at the maximum ratio CRML would issue roughly 90 million new shares, about 62 percent of its current share count, cutting other shareholders' effective interest from about 69 percent to about 53 percent on this report's arithmetic, while control remains concentrated in the former European Lithium shareholder base.
The financial position is weak. CRML's Form 20-F for the year ended 30 June 2025 carries a going-concern warning, citing working-capital deficiency and the need for additional equity or debt financing to continue operations over the following twelve months [34]. The company is pre-revenue, reporting fiscal 2025 revenue of US$560,623 and a net loss of about US$51.9 million [43]. Cash was reported at roughly US$124 million standalone around the acquisition measurement date, with European Lithium holding a further A$306 million (about US$219 million) as at 31 March 2026 [47], partly generated by selling CRML shares into the 2026 price spike [35]. This combined liquidity might carry feasibility work and early infrastructure, but it is trivial against the capital the full system requires.
The resource basis is a JORC Code 2012 estimate of 44.97 million tonnes prepared by Al Maynard and Associates in 2016 and originally disclosed through European Lithium, comprising about 25.4 million tonnes indicated and 19.5 million tonnes inferred at roughly 0.38 percent total rare earth oxides, with heavy rare earths at about 27 percent of rare earth content; an amended S-K 1300 technical report summary prepared by Agricola Mining Consultants was filed with the SEC in 2025 [8][9]. No mineral reserve has been declared under any recognized standard. The frequently promoted 4.7-billion-tonne kakortokite figure is a host-rock tonnage, and the roughly 130-million-tonne expansion objective is a drilling target; neither is a mineral resource, and both must be treated as such wherever they arise. The 2014 definitive feasibility study under the prior owner predates S-K 1300 and carries no current standing.
4. Metallurgical audit: what the numbers actually measure
The greater than 99 percent figure measures dissolution of eudialyte concentrate into solution, that is, the cracking of the silica-gel barrier, not recovery of any element at specification [1][2][3]. The release on September 16th, 2026, does not disclose the scale of the dissolution testwork, does not name the laboratory that performed it, and describes the entire product slate in conditional, design-stage language, with purities of 99.9 to 99.99 percent stated as subject to further test work and process validation [1]. Independent commentary reached the same conclusion, that the company has demonstrated neither continuous industrial-scale separation nor the supporting economics, and that the amended April 2026 S-K 1300 technical report is markedly more restrained than the press headlines, stating that additional processing work is required before rare earth concentrates could be processed into separated oxides [3].
There is no demonstration that dysprosium, terbium and yttrium have been separated into individual products at commercial purity. The disclosed flowsheet describes recovery largely as chloride salts followed by a multistage ion-exchange system, meaning the hard separation step remains modeled, not proven [1]. For each of the 19 products, the highest demonstrated scale is bench chemistry for dissolution and, for the concentrate itself, laboratory-scale beneficiation.
On beneficiation, the earlier and better-documented work is limited. Fremantle Metallurgy in Perth, under an independent reviewer, replicated and improved 2016 AMTEC and ALS results, producing a refined concentrate assaying 2.96 percent combined total rare earth and heavy rare earth oxides, about a 40 percent improvement on the 2016 figure, with better than 85 percent deportment recovery, and assays reported through Nagrom [4][5]. That grade was achieved at laboratory or bench scale. The refinery model assumes concentrate at a transfer value of about US$4,000 per tonne, but concentrate at the assumed grade has not been produced at pilot or commercial scale [5].
The proof-of-concept pilot plant, bought for about US$2 million to process 300 to 500 kilograms per hour, is a beneficiation and concentration circuit of crushers, screens and magnetic separators at roughly 1:200 of commercial scale, not a hydrometallurgical refinery pilot [4]. Its commissioning date slipped from the second quarter of 2026 to May 2026 to a stage-1 building completion in August 2026, and the most recent operational update available placed the plant at the footings stage of construction in June 2026, with the planned 150-tonne bulk sample only in field preparation rather than collected and processed [6]. The refinery chemistry and the beneficiation pilot are therefore two separate, still-unproven programs, and the September 2026 release notably did not report either pilot commissioning or bulk-sample completion.
On radiology, the deposit is very low in radionuclides, with uranium at background levels of 10 to 20 parts per million and thorium not exceeding 100 parts per million, and the S-K 1300 summary states these do not concentrate during processing [8]. That is favorable for Greenland licensing, but the concentration and disposition of any radionuclides through a chloride leach at Feldioara, a licensed uranium-processing site, remains an open permitting question the company has not resolved in public.
A decisive commercial point is that the modeled products are chloride salts, whereas buyers of hafnium, tantalum, niobium and separated heavy rare earths generally purchase metal, oxide or specification chemicals. Conversion from chloride to the forms customers actually buy is an additional cost and process step the study does not fully cost, and the freeze-dried anhydrous chloride form is asserted to command premiums without independent corroboration [1].
5. Mass balance and unit discipline
The published figures account for 100,000 tonnes of feed as roughly 27,943 tonnes of products plus 25,670 tonnes of silica plus tailings the release variously puts at about 1 percent and less than 1.5 percent, together roughly 53,600 to 54,600 tonnes, or about 54 percent of feed [1]. The remaining roughly 46 percent is unaccounted in the public disclosure. In eudialyte, that mass is sodium, calcium, iron, manganese, aluminium, chloride, water of hydration and spent reagent, which must report to some combination of recycled acid, process water, neutralization residues and gaseous streams. The claim of about 1 percent tailings cannot survive this accounting unless most of the balance leaves as recycled or neutralized liquor and water, which is not a tailings-free outcome so much as a reclassification of where waste reports. The low-waste framing should be treated as unproven.
Product tonnages are quoted as chloride salts, which overstates contained metal, because the chloride anion and waters of hydration add mass. On a contained-oxide or contained-metal basis, the 27,943 tonnes of product represents significant less contained critical-metal content than the headline implies, and the heavy rare earth fraction within it is smaller still. Company materials use "tons" that, read against the metric resource figures, are best interpreted as metric tonnes [1][8].
The same discipline applied to the 2025 preliminary economic assessment resolves an apparent absurdity. The company's own announcement of the assessment states initial production of about 85,000 tonnes per year of rare earth oxide, scalable to about 425,000 tonnes with modular expansion [7][49]. That figure cannot be contained oxide. At a resource grade of about 0.38 percent total rare earth oxides [8][9], or the 0.40 percent the announcement itself cites [49], and a bench-scale concentrate grade of about 3 percent [5], 85,000 tonnes of contained oxide a year is impossible from this deposit in early phases. The 85,000 tonnes is most plausibly concentrate tonnage, and the 425,000-tonne figure a later-phase concentrate throughput rather than oxide output, a unit error examined in Section 5.1. The assessment itself reported a pre-tax NPV of approximately US$3 billion (US$2.8 to 3.6 billion at 15 and 12.5 percent discount rates) and an IRR of approximately 180 percent, explicitly based on only about 1 percent of the host-rock tonnage; it is a scoping-level study and cannot carry the confidence of a feasibility study [7][8].
5.1 Why the company's figures do not reconcile
The most consequential inconsistency originates with the company rather than with secondary coverage. Critical Metals' 31 March 2025 announcement of the preliminary economic assessment, furnished to the SEC as an exhibit to a Form 6-K, states "Initial production ~85,000 tpa REO; scalable to ~425,000 tpa with modular expansion" and, in the same document, describes the resource as "45 Mt @ 0.40% TREO" [7][49].
The two statements cannot both hold. At the company's own grade, producing 85,000 tonnes of rare earth oxide a year would require mining about 21 million tonnes of ore annually even at perfect recovery, exhausting the entire 44.97-million-tonne indicated and inferred resource in roughly two years; at the grade of about 0.38 percent used elsewhere in this report [8][9], the arithmetic is starker still.
The expansion figure fails a second test: 425,000 tonnes a year would exceed total world mined rare earth output, which on US Geological Survey data was on the order of 390,000 tonnes of oxide in 2024 [29]. The most plausible reading is that "REO" was used where "concentrate" was meant. That reading is consistent with the Ucore letter of intent, which describes up to 10,000 tonnes of concentrate as about 10 percent of initial production and so implies initial output near 100,000 tonnes of concentrate [14]. At the 2.96 percent combined grade achieved in bench-scale concentrate work [5], 85,000 tonnes of concentrate would contain about 2,500 tonnes of rare earth oxide a year, a plausible scale for a first phase. The error has propagated: trade coverage repeated the "rare earth oxides" formulation in September 2025 and again in May 2026 [40][50], and this report did not find a subsequent company disclosure correcting it. Press releases furnished alongside a Form 6-K are not technical reports and carry no qualified person's signature, which helps explain how a headline figure of this kind can persist, but it does not excuse it, because this is the production figure most investors will have encountered.
The refinery mass balance presents a different kind of problem: its figures are incomplete rather than impossible. When a silicate concentrate such as eudialyte is dissolved in hydrochloric acid, the sodium, calcium, iron, manganese, potassium and aluminium it contains become soluble chlorides, and much of the oxygen bound in the mineral lattice leaves as water. Unless those elements are recovered and sold, they must report to brine, wastewater or neutralization residues, and precipitated iron and manganese residues are solids that would ordinarily count as waste. The company's September 2026 release is consistent with this chemistry. It describes a low-wastewater design with limited discharge and potential treatment at third-party or approved government facilities in Romania, and it attributes part of the low tailings figure to the prospective recovery of alumina, iron and copper [1].
The roughly 46 percent of feed mass therefore most plausibly sits in liquid effluent and in by-product streams whose recovery has not been demonstrated. The concern is presentational and regulatory: a tailings figure of about 1 percent is offered as an environmental advantage, while the tonnage and composition of the brine and residue streams, which will govern permitting at a licensed uranium-processing site, go unquantified. Product tonnages compound the difficulty, because chloride salts overstate contained metal by large and uneven factors. A tonne of niobium pentachloride contains only about a third of a tonne of niobium, and a tonne of tantalum pentachloride about half a tonne of tantalum, so a headline of 27,943 tonnes of product says little about the contained value of the slate.
The supply figures discussed in Section 6 fail to reconcile chiefly because they are stated in different units at different project stages, and the units are seldom labeled. The definitive feasibility study is scoped around a 500,000-tonne-per-year mining and processing operation, which reads as ore throughput [40]. The preliminary economic assessment gives 85,000 tonnes a year, labeled as oxide but plausibly concentrate [7]. The Ucore letter implies about 100,000 tonnes of concentrate [14], market coverage attributes to the company a 2030 target of roughly 130,000 tonnes a year [41], and the refinery is designed for up to 100,000 tonnes of concentrate a year while receiving only 50 percent of production [1]. Converting these on the company's own parameters, and assuming for illustration that the bench-scale concentrate grade of 2.96 percent and the reported deportment recovery of better than 85 percent hold at scale, 500,000 tonnes of ore would yield roughly 57,000 tonnes of concentrate a year [5]. Running the refinery at nameplate would instead require about 200,000 tonnes of concentrate, or roughly 1.7 million tonnes of ore a year, about three and a half times the throughput the feasibility study is examining. That rate is not impossible against the resource, which on this report's arithmetic would last about 26 years at that pace, but it shows that the refinery has been sized, costed and marketed for a mine considerably larger than the one currently being engineered.
Where the inconsistencies sit is itself informative. They are concentrated in press releases and in the coverage built on them, while the S-K 1300 technical report summary, which a qualified person must sign, is markedly more restrained and states that further processing work is required before the concentrate could be converted into separated oxides [3][8]. A persistent gap between signed technical documents and promotional announcements is characteristic of early-stage developers whose market value depends on headline figures. In this case it coincides with other features of that profile: a going-concern qualification [34]; preliminary valuations of US$3 billion and US$4.5 billion published ahead of any feasibility study [1][7]; non-binding term sheets presented as committed offtake [10][15]; a state-owned refinery partner that says it has not validated the refinery study [11]; and sales of CRML shares by the largest shareholder into price rallies [35]. None of this establishes that technical data have been fabricated. In the materials reviewed, this report did not identify inconsistencies within the filed technical reports themselves, restatements, or the withdrawal of a qualified person's approval, although a systematic review of the full filing history was outside its scope. The evidence is better read as a disclosure-quality problem, in which headline figures are communicated ahead of, and sometimes in conflict with, the engineering that should support them.
The practical implication is that company figures warrant a larger discount than the project's stage alone would justify, and that the definitive feasibility study now guided for the end of 2026 is the decisive test [41]. A study that states units consistently, closes the refinery mass balance with brine and residue streams quantified, reconciles mine throughput with refinery feed and offtake allocations, and carries a qualified person's signature would materially improve confidence in the project's numbers. A study that slips again, or that defers these reconciliations to later phases, would confirm the pattern described here. A correction of the March 2025 production statement would be a low-cost signal of improved disclosure discipline, and its continued absence is a reasonable question for investors to put to management.

6. Supply reconciliation across mine, offtakes and refinery
The internal numbers do not cleanly reconcile. The refinery is designed for up to 100,000 tonnes per year of concentrate and is to receive 50 percent of production, which implies full utilization needs at least 200,000 tonnes per year of Tanbreez concentrate [1][10]. Yet the Ucore letter of intent for up to 10,000 tonnes was described as about 10 percent of initial production, implying initial output near 100,000 tonnes per year [14]. On that Phase 1 basis, 50 percent to the joint venture is only 50,000 tonnes, so the refinery would run at half its nameplate, while the REalloys 15 percent, Ucore 10 percent and Saudi 25 percent allocations consume the rest [12][14][33]. Full 100,000-tonne refinery utilization is therefore a later-phase proposition dependent on the mine reaching roughly 200,000 tonnes per year of concentrate, well beyond the roughly 130,000 tonnes per year the company has floated as a 2030 target [41]. Meanwhile the NIRAS-led definitive feasibility study is scoped around a 500,000-tonne-per-annum mining and processing operation, a third throughput frame that must be reconciled before any of these allocations are credible [40]. The REalloys priority on dysprosium- and terbium-rich material also competes directly with the refinery for the highest-value feed [12].
 John D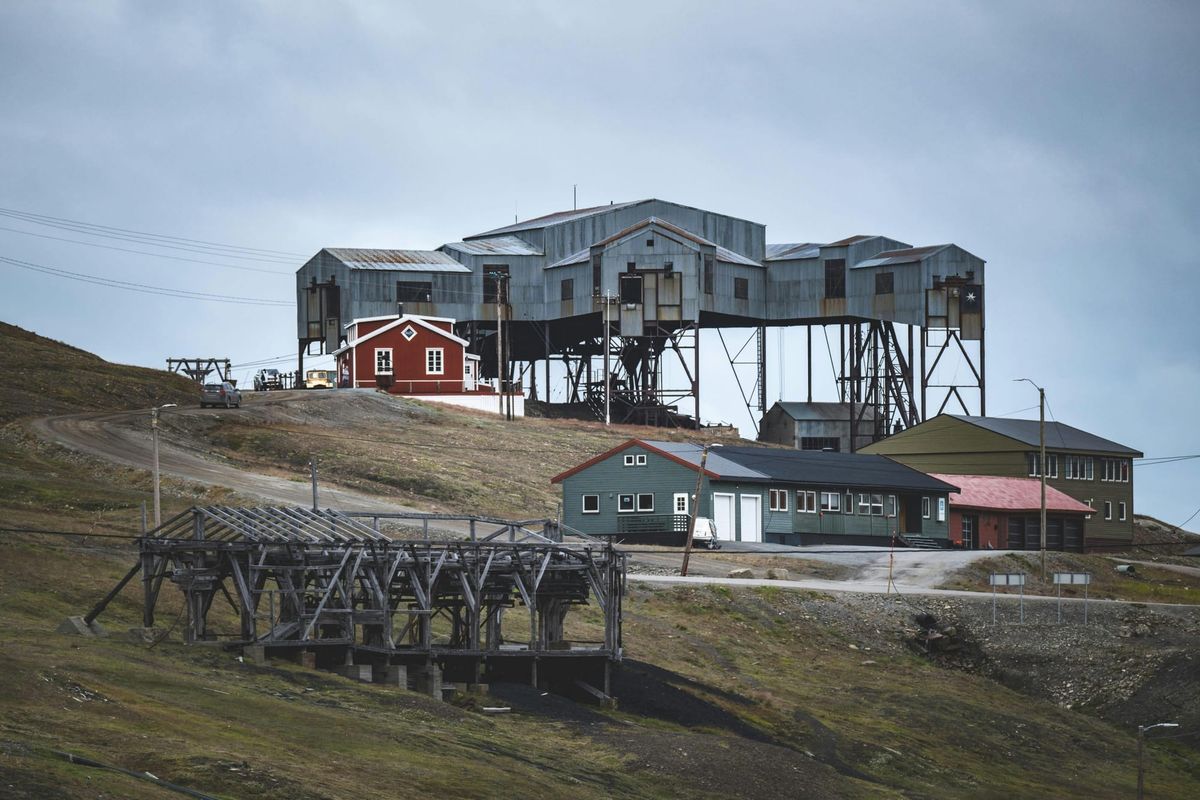
7. Refinery economics
The company models annual revenue of approximately US$2.2 billion before operating costs, taxes and capital recovery, within a headline range of US$1.8 to 2.2 billion, on a preliminary capital estimate of US$1.85 billion described as a Class 4 estimate at plus or minus 25 percent, with an NPV10 of approximately US$4.5 billion, an IRR of approximately 55 percent and payback of about two years [1]. These are company modeling outputs on price and recovery assumptions the company has not fully disclosed, and they carry the confidence of a preliminary study, not a feasibility study. Nuclearelectrica has publicly characterized the underlying document as a prefeasibility study prepared by CRML that remains under technical-economic evaluation at FPCU and has received no validation from Nuclearelectrica or FPCU, adding that neither has allocated or spent funds on the project [11].
Decomposing the revenue confirms the by-product hypothesis. Silica at 25,670 tonnes is modeled to generate about US$600 million, an implied average of roughly US$23,000 per tonne, and the company names its key value drivers as silica, niobium pentachloride, dysprosium chloride, tantalum pentachloride and hafnium [1]. Silica alone is about 27 percent of modeled revenue, and on this evidence the project is substantially a silica, niobium, tantalum, hafnium and zirconium-family story in which separated heavy rare earths are a meaningful but minority contributor, the opposite of the marketing emphasis.
Several price and depth assumptions do not withstand scrutiny. Hafnium is recovered globally as a by-product of nuclear-grade zirconium at roughly one tonne per fifty tonnes of zirconium; the US Geological Survey states plainly in its Mineral Commodity Summaries 2026 that world primary hafnium production data and quantitative reserve estimates were not available, and names China and Germany as the leading exporters of unwrought hafnium, so the frequently cited 70 to 75 tonnes per year of world output is a private trade estimate rather than an official figure and should be treated as such [25]. The international unwrought price was around US$12,500 per kilogram in 2026 [26][27]. A single refinery adding 50 to 70 tonnes per year of hafnium metal would, against that estimated base, roughly double world supply and collapse the price it is valued at, so the hafnium line cannot simultaneously carry the modeled volume and the modeled price [1][27]. High-purity silica at an implied US$23,000 per tonne is far above bulk silica values and would require a genuine electronics-grade quartz market that 25,670 tonnes per year could saturate.
On heavy rare earths, ex-China prices have been extraordinary since China's April 2025 controls, with yttrium oxide reported near US$1,100 per kilogram, dysprosium oxide around US$1,450 per kilogram and terbium oxide around US$4,500 per kilogram outside China, against Chinese domestic references far lower, roughly US$208 to 239 per kilogram for dysprosium and about US$1,097 per kilogram for terbium in September 2026 [28][29][30]. Modeling revenue at the elevated ex-China levels embeds an assumption that a durable bifurcated premium survives the arrival of new supply, which is circular for a project whose purpose is to add that supply.
The NPV10, IRR and payback cannot be reproduced from disclosed inputs because ramp profile, sustaining capital, working capital, tax, royalty, realization discounts, energy and carbon prices are not published. A two-year payback on a US$1.85 billion plant implies roughly US$900 million per year of after-cost cash flow, consistent only with the high-price case and full utilization from day one, which contradicts every ramp and utilization consideration above. The plus or minus 25 percent accuracy claimed is at the optimistic edge of the AACE International Recommended Practice 18R-97 range for a Class 4 estimate, which is typically wider, and for a first-of-a-kind eudialyte refinery a prudent contingency would be larger still.
Benchmarking underscores the ramp risk. Western rare earth separation projects have a consistent record of delay and cost overrun, from Lynas Rare Earths (ASX:LYC) in Malaysia and Kalgoorlie to Iluka Resources' Eneabba refinery, Solvay's La Rochelle expansion, Neo Performance Materials' Silmet plant, Energy Fuels' White Mesa circuit and the Molycorp-era Mountain Pass restart. Lynas produced its first separated dysprosium oxide on 16 May 2025 and its first terbium in June 2025, and shipped its first separated heavy rare earths to customers under signed contracts at a strategic premium during the first half of fiscal 2026, describing itself as the only commercial producer of separated heavy rare earth products outside China; that milestone came after years of effort and on the back of a strong balance sheet [42]. Against that base rate, a two-year payback for a novel eudialyte flowsheet is not a credible planning case.
Value capture is skewed by structure. At a US$4,000 per tonne concentrate transfer price, the mine, which CRML owns 92.5 percent moving to 100 percent, captures the transfer value, while the refinery margin accrues to the 50:50 joint venture in which CRML holds half [1][10]. CRML's attributable economics from the refinery are therefore roughly half of the joint venture result, before any Romanian state, EU or lender claims, a point the consolidated headline revenue obscures.
8. Mine, infrastructure and logistics
The mine is an Arctic fjord-side operation on the Fjord and Hill zones, with the Fjord zone holding about half of the 45-million-tonne resource and drilling to date focused on the eudialyte component [40]. The concentrator relies on high-intensity magnetic separation to lift a low-grade feed to a roughly 3 percent concentrate [5]. The 2014 definitive feasibility study and environmental impact assessment under the prior owner predate S-K 1300 and do not carry current standing; a NIRAS-led definitive feasibility study, environmental impact assessment and social impact assessment, plus an updated exploitation plan, must be completed and approved, with the study guided to end-2026 [40]. Company materials cite year-round deep-water port access to the North Atlantic and free-on-board shipping from southern Greenland [12], but Arctic logistics costs are structurally high and the transport of a radionuclide-bearing concentrate by sea to a European port and then by rail or inland waterway to Brasov introduces classification, cost and handling questions the company has left to future evaluation [1].
9. Offtake architecture
The legal status of the offtake book is uneven, and the company's presentation of 75 percent committed overstates the binding reality. The REalloys Inc. (NASDAQ:ALOY) agreement of 20 May 2026 is a binding 15-year definitive offtake for 15 percent of Phase 1 concentrate, with market-referenced element-by-element pricing, priority on dysprosium- and terbium-rich material, a right of first refusal, two five-year extension options and a five-year long-stop date after which either party may terminate if first delivery has not occurred [12][13]. The Ucore Rare Metals Inc. (TSXV:UCU) arrangement is a non-binding letter of intent from August 2025 for up to 10,000 tonnes per year, destined for its Department of Defense-funded Louisiana facility [14]. The Saudi arrangement is a non-binding term sheet with the Tariq Abdel Hadi Abdullah Al-Qahtani and Brothers Company, a private industrial conglomerate distinct from the state mining vehicles Maaden and Manara Minerals, for a 50:50 processing joint venture and 25 percent life-of-mine offtake on a carried-interest basis for CRML, with a facility valued up to US$1.5 billion [33]. A December 2025 Form 6-K described the arrangements then in place as non-binding term sheets [15]. Only the REalloys contract is a true binding third-party offtake; the 50 percent allocated to the Romanian joint venture is self-offtake to an entity CRML would half-own, not independent demand. Counterparty capacity is also uncertain: REalloys is a small vertically integrated magnet developer, Ucore is a pre-commercial processor reliant on Department of Defense support, and none has demonstrated processing configured for eudialyte concentrate at scale.
10. Financing and corporate capacity
Sources identified fall far short of sources required. The Export-Import Bank of the United States issued a non-binding letter of interest in June 2025 for up to US$120 million over 15 years under its Supply Chain Resiliency Initiative, explicitly conditioned on the project being well-capitalized with sufficient equity from strategic investors, and described as covering nearly half of a roughly US$290 million cost to first production [16][17]. That letter addresses the mine, not the refinery. The US$1.85 billion refinery capital has no identified source: CRML is to be carried in the Saudi structure and holds half of the Romanian structure, Nuclearelectrica states it has neither allocated nor spent funds, and no Romanian state aid, EU instrument or export-credit facility has been confirmed [11][33]. A US$30 million acceleration program approved in March 2026 targets 6,000 metres of drilling, first ore in late 2028 to early 2029 and first concentrate export in the third quarter of 2029 [6][41]. Set against a going-concern balance sheet, the gap between a few tens of millions in hand and multiple billions required is the central financing fact [34]. On capacity, the management team is promoter-led with no demonstrated record of delivering a multi-billion-dollar, two-jurisdiction processing build, and the related-party structure compounds governance risk.
 John D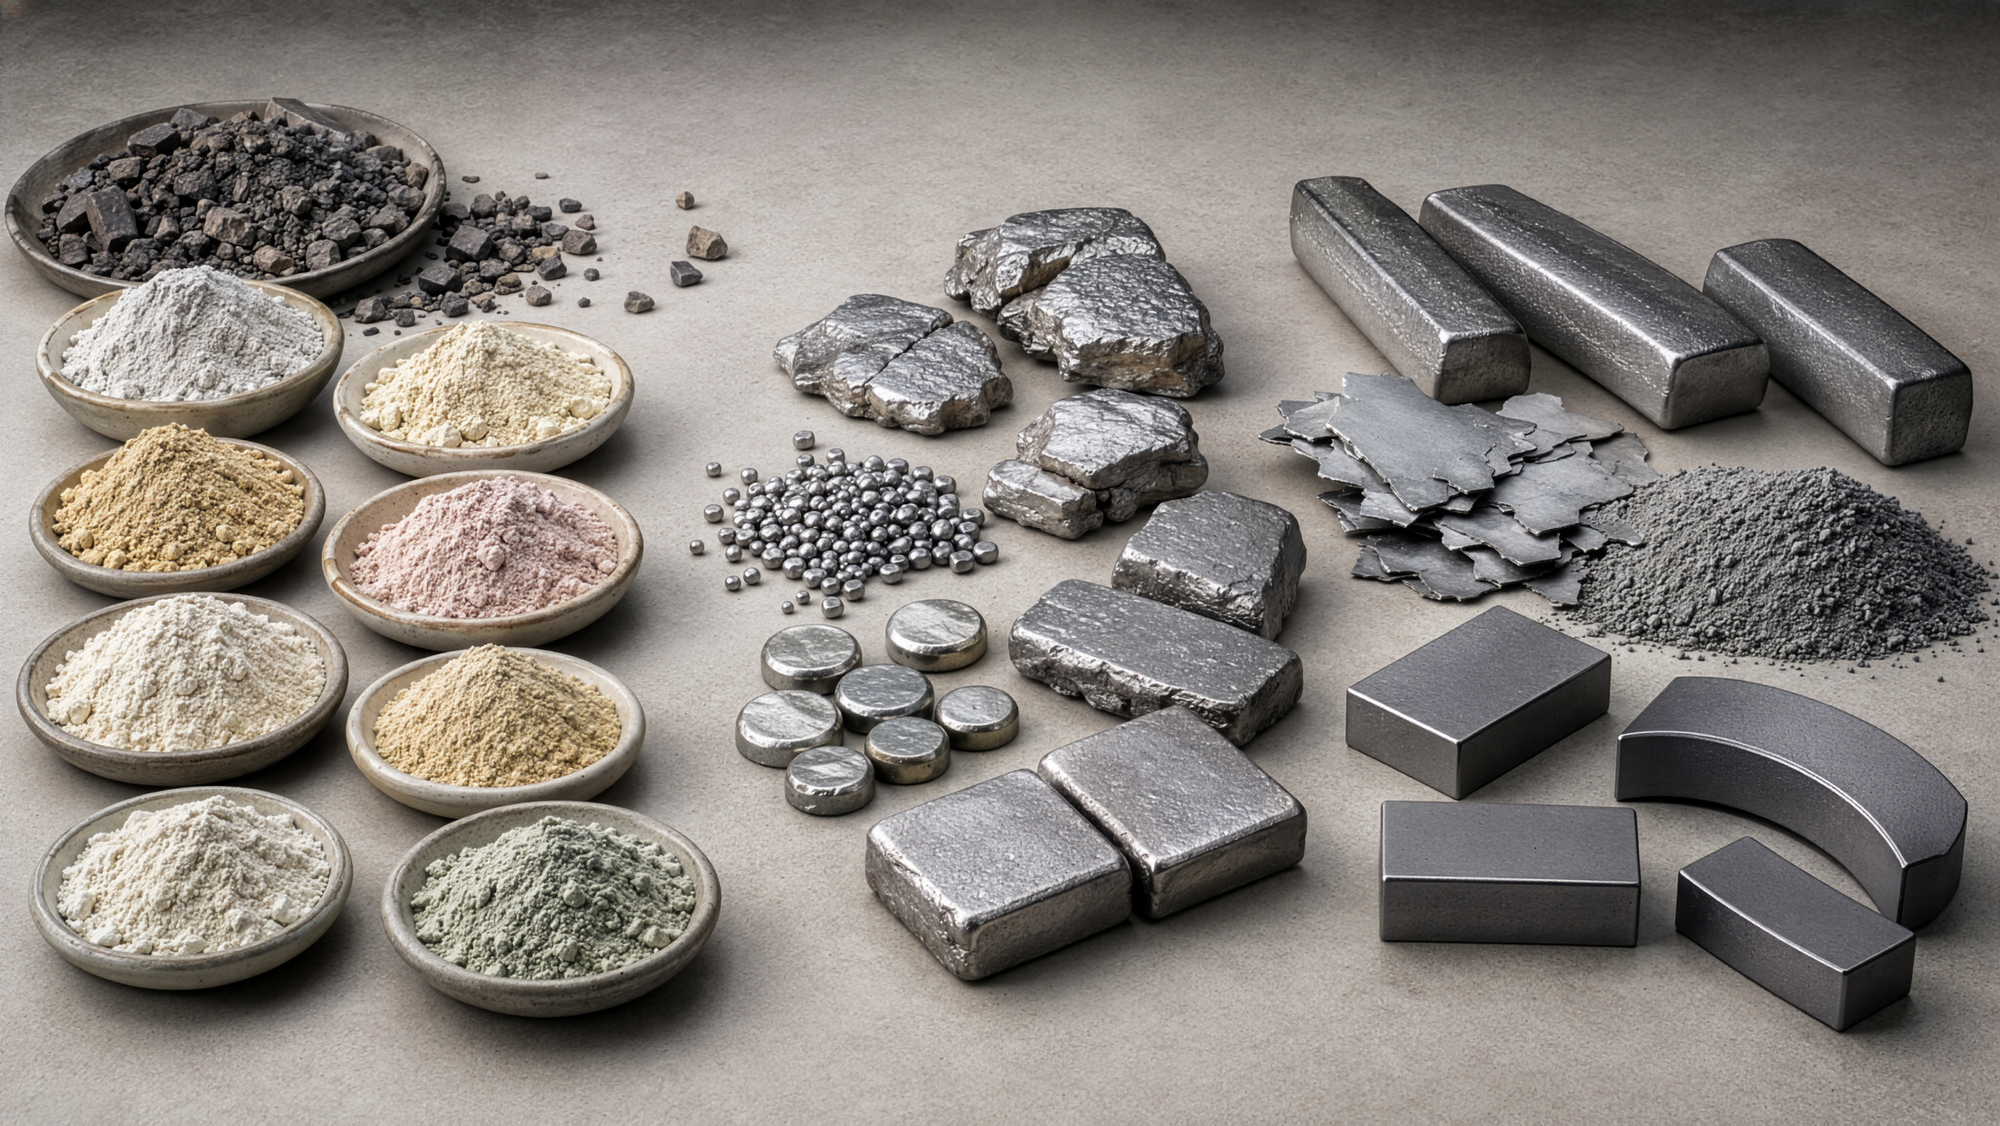
11. Supply-side analysis
Supply and separation of dysprosium, terbium and yttrium remain overwhelmingly Chinese. China produced an estimated 270,000 tonnes of rare earth oxides in 2024, about 69 percent of world mined production, leaving on the order of 120,000 tonnes for the rest of the world, and heavy rare earth separation outside China was negligible at commercial scale until Lynas began producing separated dysprosium and terbium in 2025 [29][42]. For hafnium and the zirconium family, ex-China production is concentrated in a handful of Western producers tied to nuclear-grade zirconium, with the United States producing zirconium and hafnium metal from chemical intermediates at single producers in Oregon and Utah, and France's Framatome CEZUS a key hafnium source; USGS identifies China and Germany as the leading exporters of unwrought hafnium [25]. Against this, the modeled Tanbreez heavy rare earth volumes would be material to the thin ex-China market, and the hafnium volume would be system-changing to the point of implausibility, but only if the plant is ever built and ramped. The competing ex-China heavy rare earth pipeline, including Lynas, Energy Fuels and various early-stage projects, is itself mostly pre-commercial, so Tanbreez's cost-curve position cannot be reliably placed; the honest statement is that the data do not permit it, because no eudialyte operation exists anywhere to benchmark against.
 John D
12. Demand-side analysis
Demand for dysprosium and terbium is driven by high-temperature neodymium-iron-boron magnets for electric-vehicle traction motors, wind turbines, robotics, aerospace and defense; yttrium serves phosphors, ceramics and alloys; hafnium serves superalloys, nuclear control and semiconductor high-k dielectrics; and niobium and tantalum serve superalloys, capacitors and electronics [27]. The critical demand-side caveat for the heavy rare earth revenue is thrifting and substitution: grain-boundary diffusion has steadily reduced the dysprosium and terbium loading per magnet, and magnet designs that minimize heavy rare earths are an active engineering priority precisely because of supply risk. Sustained elevated ex-China prices accelerate this substitution, which erodes the very price assumptions the refinery model relies on. Hafnium and semiconductor-linked demand are structurally growing, but from a tiny base that cannot absorb the modeled tonnage.
13. Pricing and market structure
None of the key products trades on a transparent exchange. Rare earths trade over the counter with bilateral pricing and reference assessments from Fastmarkets and others, and the market is now explicitly bifurcated, with China-domestic references far below ex-China deliverable prices; Fastmarkets launched dedicated CIP global heavy rare earth assessments precisely to capture this ex-China reality [30][44]. Hafnium has no futures contract, with a weekly bar assessment and almost all sales on long-term contracts to a few nuclear-grade and superalloy consumers, so a new entrant cannot sell system-changing volume into it without collapsing price [25]. The durability of the ex-China premium is the single most important pricing question, and it is unresolved: it depends on whether China maintains export licensing after the November 10th, 2026, suspension expiry and on how much ex-China supply arrives. Government price floors are becoming a structural feature, exemplified by the Department of Defense floor for MP Materials discussed below, and any ex-China heavy rare earth economics increasingly assume such support rather than a free market.
14. Key players
CRML is the promoter and integrator, promoter-controlled through European Lithium and linked in reporting to Frank Timis [36]. European Lithium is the dominant shareholder and acquisition target. FPCU is a state-owned uranium-concentrate processor, wholly owned by Nuclearelectrica, itself majority-owned by the Romanian state, and its public posture is cautious, stressing the non-binding, unvalidated status of the study [10][11]. REalloys is the one binding offtaker, a US vertically integrated magnet developer serving protected defense markets [13]. Ucore is a pre-commercial processor with Department of Defense backing in Louisiana [14]. The Saudi counterparty is a private industrial conglomerate [33]. Government actors span Greenland, Denmark, Romania, the EU and the United States, each with leverage but none having conferred a mining right, permit, offtake or funding commitment on CRML through the security announcement [23].
15. Geopolitical and policy dimensions
Greenland's Mineral Resources Act governs licensing, and Act No. 20 of 2021 bans exploration and exploitation where uranium content reaches or exceeds 100 parts per million in the total resource, the legislation that halted Kvanefjeld and triggered arbitration by Energy Transition Minerals [18][20]. Tanbreez sits comfortably below that threshold at 10 to 20 parts per million uranium and thorium not exceeding 100 parts per million, which is the project's central jurisdictional advantage over its neighbor [8]. The Greenland authority has, however, signaled it may examine a thorium threshold, which would not affect existing licences but is a watch item [19]. Greenlandic politics favor development that does not breach the uranium line, and the relationship with Denmark remains the constitutional backdrop.
The security agreement announced among the United States, Denmark and Greenland, reported for signature at the UN General Assembly with its text unpublished at the time of writing, is described in press reporting citing a State Department official as guaranteeing that China and Russia cannot base or invest in sensitive sectors including minerals, while leaving Greenlandic control of its own affairs intact [23][24]. As reported, it confers no mining right, permit, offtake or funding on CRML, and the roughly 36 percent share price move on September 21st, 2026, reflects sentiment rather than a change in project fundamentals [23]. Treated correctly, the agreement reduces the risk of an adversary acquirer and signals Western political alignment, but it does not build a plant or finance one.
For Romania, the refinery sits at a licensed uranium-processing site, so environmental and radiological permitting is central, and the partner is state-controlled with the attendant procurement and governance constraints [11]. Whether either node has applied for or received EU Critical Raw Materials Act strategic-project status is not established in the sources reviewed, and no such designation should be assumed. Energy and carbon costs matter because the design contemplates up to 150 MW, with 60 to 70 percent from gas-fired kilns and boilers, exposing operating costs to EU Emissions Trading System carbon prices [1].
For the United States, the precedent that matters is the July 2025 Department of Defense partnership with MP Materials Corp. (NYSE:MP), which established a ten-year price floor of US$110 per kilogram for neodymium-praseodymium products via a contract-for-difference in which the Department pays the difference when the market is below the floor and takes 30 percent of the upside above it; that floor is more than twice MP's 2024 realized NdPr price of about US$51 per kilogram, and the package also included equity, a loan and a magnet offtake [31][32]. This is the template any US-facing heavy rare earth economics now implicitly rely on, and REalloys' offtake, aimed at supplying defense markets ahead of procurement restrictions on Chinese-origin material phasing in from 2027, is best read as depending on continued policy support rather than free-market pricing [12].
For China, the April 2025 licensing regime under MOFCOM Announcement No. 18 covering samarium, gadolinium, terbium, dysprosium, lutetium, scandium and yttrium remains in force, while the October 2025 expansion, including its extraterritorial 0.1 percent rule, is suspended until 10 November 2026 under Announcement No. 70 [21][22]. The central risk is that once new ex-China supply threatens its position, China can raise export volumes and depress prices, undercutting projects like Tanbreez whose models assume a persistent premium.
16. Development pathway and timeline realism
Company guidance places the definitive feasibility study at end-2026, first ore in late 2028 to early 2029 and first concentrate export in the third quarter of 2029, with no stated refinery completion date [6][40][41]. Milestones have already slipped: the feasibility study moved from the fourth quarter of 2025 to end-2026, and pilot commissioning drifted from the second quarter of 2026 to a building completion in August 2026 [4][6][40]. Industry base rates from preliminary economic assessment to production for a novel flowsheet run well beyond these figures, and rare earth refinery ramp-ups routinely take years past first feed. Reasoning forward from current evidence, and stating the assumptions plainly, first concentrate on the guided 2029 timing would require financing, permitting and construction to proceed without the delays that have characterized every comparable Western project and this project's own recent history, which is unlikely. First separated dysprosium, terbium and yttrium from the integrated system, which additionally requires a signed and financed refinery and a successful continuous separation ramp, is on an early-to-mid 2030s proposition at best and is contingent on the metallurgy scaling up.
17. Risk matrix
The following matrix states, for each risk, its likelihood, potential impact and credible mitigations.
Recommendations
For the public-equity investor, CRML is a high-beta, promoter-controlled, pre-revenue developer whose valuation is driven by narrative catalysts rather than demonstrated cash flow, carrying a going-concern qualification and facing very large dilution through the European Lithium acquisition [34][37]. Treat any position as speculative and sized for total loss. The staged approach is to gate exposure to hard technical and corporate milestones rather than press releases: do not underwrite the refinery thesis until an independently validated continuous pilot reproduces the dissolution chemistry and, critically, separates individual heavy rare earths at specification; do not credit the refinery capital until a definitive Romanian joint venture agreement is signed and a funding source for the US$1.85 billion is named.
The near-term catalysts are discrete and binary: the October 22nd, 2026, European Lithium vote and November completion, publication of the security agreement text, the November 10th, 2026, expiry of China's suspension, actual pilot-plant and bulk-sample results, the end-2026 feasibility study, any definitive Romanian joint venture agreement, financing commitments and Greenland permit decisions [22][37]. The thesis fails, and a position should be exited, if the pilot cannot reproduce the bench chemistry at scale or cannot separate individual heavy rare earths, if the refinery joint venture is not signed and financed, if China depresses prices after the suspension lapses, or if the going-concern position forces dilutive emergency financing.
For an investor seeking ex-China heavy rare earth exposure with demonstrated production, the honest conclusion is that CRML is not it today; Lynas is the clearest operating example of separated heavy rare earth supply, and MP Materials the clearest policy-backed integrated play, though neither is a Tanbreez proxy [31][42].
For the corporate procurement strategist at a magnet maker, defense prime or hafnium consumer, Tanbreez-derived supply cannot be relied upon within this decade and should not appear in a base-case sourcing plan. It can reasonably feature as a long-dated optional supplement, secured through a qualification agreement and a right to sample material, mirroring the REalloys structure, but the immediate hedges remain the ones already in the market: contracting Lynas and other qualified ex-China separated supply, engineering down heavy rare earth loadings through grain-boundary diffusion, and, for hafnium, long-term contracts with incumbent zirconium-linked producers rather than any expectation of large new eudialyte-derived tonnage [42][25]. The benchmark that would change this posture is a demonstrated, independently verified continuous production of separated, specification-grade heavy rare earth or hafnium product from Tanbreez feed at pilot scale or greater.
A development-finance perspective is warranted only briefly: the asset's strategic logic, a Western, EU-and-NATO-located, low-radioactivity heavy rare earth source, is exactly what public financiers wish to support, which is why an EXIM letter and political tailwinds exist [16][23]. However, the same institutions condition support on equity, feasibility-grade studies and demonstrated metallurgy, none of which the project yet has, so public capital is likely to remain in the letter-of-interest stage until the technical and corporate gaps close.

Caveats
The evidence base is dominated by company disclosures, with independent corroboration thin, exactly as expected for an early-stage project in opaque markets, and this report has treated every company figure as asserted rather than established. Key figures, including the dissolution scale and performing laboratory, the undisclosed price and recovery assumptions behind the NPV10 and IRR, and the unaccounted mass in the balance, could not be verified against independent sources, and this is stated in the text rather than papered over. Price figures derive from price reporting agencies and specialist trackers whose heavy rare earth and hafnium assessments are thin and bilateral by nature, and the widely cited 70-to-75-tonne hafnium market figure is a private trade estimate that the US Geological Survey explicitly does not publish [25]. The security agreement text was unpublished at the time of writing and is cited only as press reporting. Several inputs, notably the exact CRML ownership percentage held by European Lithium, are reported inconsistently across sources, and where reconciliation was not possible the conflict has been noted rather than resolved.
 John D
 John D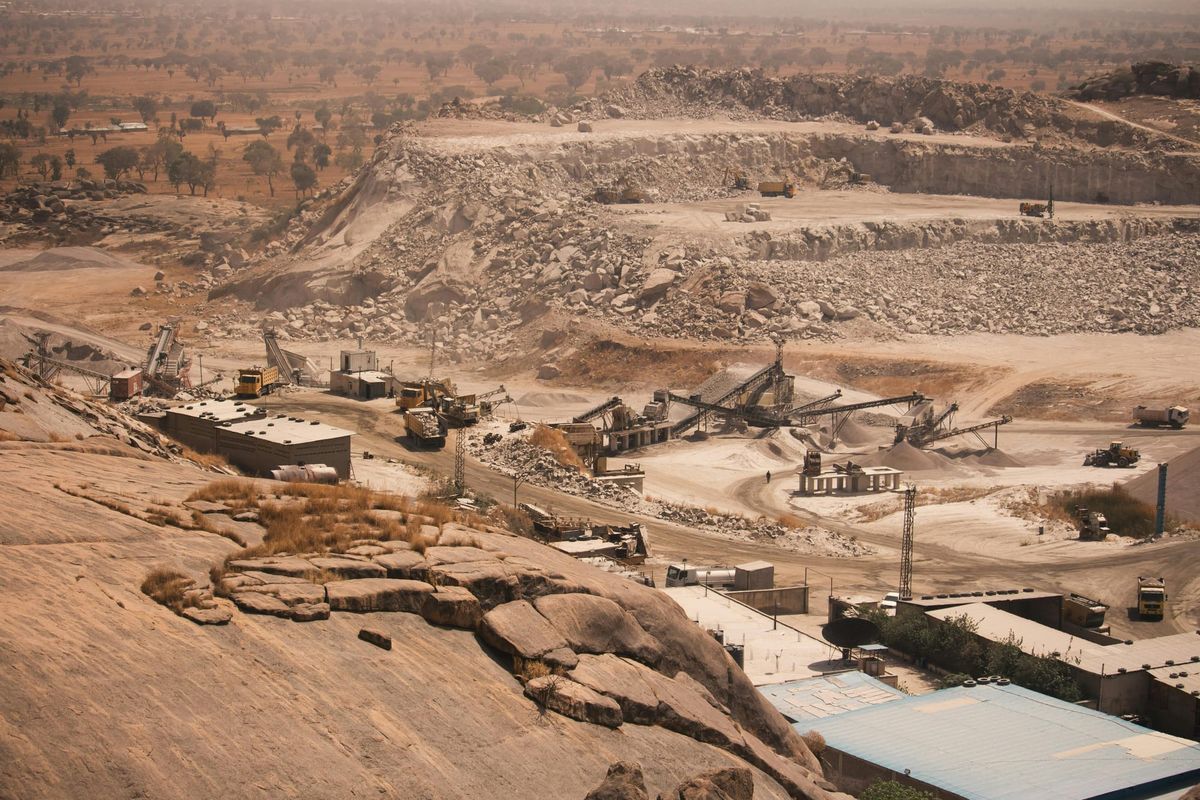
 John D
References
[1] Critical Metals Corp. 2026. "Achieves Breakthrough Tanbreez Heavy Rare Earth Results: >99% Dissolution of Eudialyte Concentrate Into 19 Ultra-High-Purity Rare Earth Products; Refinery Study Projects US$1.8-2.2b in Annual Refinery Revenue." GlobeNewswire, September 16.
[2] Mining.com. 2026. "Critical Metals says it has 'cracked' eudialyte hurdle, plans $2.2B a year refinery in Romania." September 16.
[3] Rare Earth Exchanges. 2026. "Critical Metals Tanbreez Eudialyte Dissolution Claims Explained." September 20.
[4] Critical Metals Corp. 2025. "Confirms Metallurgical Test Work Results at Tanbreez Support Refinery JV in Romania." GlobeNewswire, December 11.
[5] Critical Metals Corp. 2026. "Confirms Outstanding 2.96% TREO and HREO Refined Concentrate, Yielding ~40% Increase in Historical Metallurgical Test Work Results at Tanbreez." GlobeNewswire, March 31.
[6] Critical Metals Corp. 2026. "Provides Project Update on Acceleration Plan and Tanbreez Development Progress." GlobeNewswire, June 2.
[7] Critical Metals Corp. 2025. "Tanbreez Valued at $3 Billion With IRR of 180% and Significant Additional Upside Potential." GlobeNewswire, March 31.
[8] Castle, Malcolm, Agricola Mining Consultants Pty Ltd. 2025. "S-K 1300 Technical Report Summary and Preliminary Economic Assessment, Tanbreez Project, Greenland." March.
[9] European Lithium Ltd. 2025. "Maiden Mineral Resource Estimate 45MT Tanbreez Rare Earth Project Greenland" (Al Maynard and Associates, 2016 JORC estimate). Investing News Network.
[10] Critical Metals Corp. 2025. "CRML Executes Term-Sheet for 50/50 Joint Venture With EU and NATO Member, Romania." GlobeNewswire, December 9.
[11] HotNews.ro. 2026. "O companie controlata de Frank Timis sustine ca va prelucra metale rare intr-o fabrica de 1,8 miliarde de dolari in Romania," incorporating Nuclearelectrica statement. September 18.
[12] Critical Metals Corp. 2026. "CRML Executes a 15-Year Binding Definitive Off-Take Agreement for Tanbreez with REalloys Inc." GlobeNewswire, May 21.
[13] REalloys Inc. 2026. "REalloys Signs Definitive Long-Term Rare Earth Offtake Agreement with Critical Metals Corp. for 15% of Tanbreez Phase 1 Production." realloys.com.
[14] Critical Metals Corp. 2025. "Secures 10-Year TANBREEZ Off-Take Agreement with Department of Defense Funded Rare Earth Processor Ucore Rare Metals." GlobeNewswire, August 26.
[15] Critical Metals Corp. 2025. Form 6-K. US Securities and Exchange Commission.
[16] Critical Metals Corp. 2025. "Secures US$120,000,000 LOI for a 15-Year Term Loan From the US EXIM Bank for the Development of its Tanbreez Rare Earth Project." GlobeNewswire, June 16.
[17] Mining.com. 2025. "Critical Metals in line for $120M US loan to fund Greenland rare earth project." June.
[18] World Nuclear News. 2021. "Greenland Minerals seeks clarity on Kvanefjeld licence."
[19] Naalakkersuisut, Mineral Resources Authority. 2022. "The ban on uranium." govmin.gl.
[20] Wikipedia. 2026. "Kvanefjeld."
[21] China Briefing (Dezan Shira and Associates). 2025. "China's Rare Earth Export Controls: Impact on Businesses and Industries."
[22] Carra Globe. 2026. "China Rare Earth Export Controls 2026: The 0.1% Rule Returns November 10."
[23] CNBC. 2026. "U.S.-listed Greenland stocks surge after Trump announces security deal with Denmark." September 21.
[24] Christian Science Monitor. 2026. "Greenland deal: What did the US and Denmark actually agree to?" September 21.
[25] US Geological Survey. 2026. Mineral Commodity Summaries 2026: Zirconium and Hafnium.
[26] Strategic Metals Invest. 2026. "Hafnium Price Today: Historical Charts and Forecast."
[27] Expert Market Research. 2026. "Hafnium Metal Price Trend 2026 Forecast."
[28] Rare-earth-mining.com. 2026. "Dysprosium Price Today" and "Terbium Price Today" (Shanghai Metals Market domestic benchmarks, September 3).
[29] The Oregon Group. 2026. "Rare Earth prices surge as China keeps export restrictions" (Argus and Reuters data); US Geological Survey Mineral Commodity Summaries 2025 for 2024 production shares.
[30] Rare Earth Exchanges. 2026. "Dysprosium Terbium Ex-China vs China Prices Explained."
[31] MP Materials Corp. 2025. "MP Materials Announces Transformational Public-Private Partnership with the Department of Defense." July 10.
[32] Federation of American Scientists. 2025. "Unpacking the DoD and MP Materials Critical Minerals Partnership"; Payne Institute for Public Policy, 2025, "Explainer on the MP Materials-Department of Defense Partnership."
[33] Critical Metals Corp. 2025. "Executes a Term Sheet for a 50/50 Joint Venture for Up-To US$1,500,000,000 Rare Earth Processing Facility with a Leading Saudi Arabian Industrial Conglomerate." Yahoo Finance and MarketScreener.
[34] Critical Metals Corp. 2025. Form 20-F for the year ended 30 June 2025. US Securities and Exchange Commission.
[35] 24/7 Wall St. 2026. "Up 158% in 2026, Is Critical Metals Too Hot to Touch?" January.
[36] Rare Earth Exchanges. 2026. "Romania's Rare Earth Processing Ambitions: Ownership."
[37] Ad-hoc-news and TipRanks. 2026. Reporting on the European Lithium and Critical Metals scheme of arrangement (US$835 million, 41 percent pro forma, exchange ratio and collar, 22 October vote).
[38] Davris, P., S. Stopic, E. Balomenos, D. Panias, I. Paspaliaris, and B. Friedrich. 2017. "Leaching of rare earth elements from eudialyte concentrate by suppressing silica gel formation." Minerals Engineering 108: 115-122.
[39] Vossenkaul, D., A. Birich, N. Muller, N. Stoltz, and B. Friedrich. 2016. "Hydrometallurgical Processing of Eudialyte Bearing Concentrates to Recover Rare Earth Elements Via Low-Temperature Dry Digestion." Journal of Sustainable Metallurgy; and Johnson Matthey Technology Review, 2019, "Hydrometallurgical Treatment of an Eudialyte Concentrate for Preparation of Rare Earth Carbonate."
[40] Mining.com. 2025. "Tanbreez rare earth project feasibility on course for Q4 completion" (NIRAS-led definitive feasibility study).
[41] StockTitan. 2026. "CRML Stock Price, News and Analysis" (development targets and milestones).
[42] Rare-earth-mining.com. 2026. "Rare Earth Market Outlook March 2026: Western Supply Chain Milestone" (Lynas first separated dysprosium and terbium production and shipments).
[43] StockAnalysis.com. 2026. "Critical Metals (CRML) Stock Price and Overview" (FY2025 revenue and net loss).
[44] Fastmarkets. 2026. "Fastmarkets launches three new CIP global heavy rare earths price assessments."
[45] Critical Metals Corp. 2026. Form 6-K, Report of Foreign Private Issuer (European Lithium scheme booklet materials). US Securities and Exchange Commission, September 16.
[46] Mining Technology. 2024. "European Lithium and Sizzle Conclude Business Merger." March 1.
[47] Critical Metals Corp. 2026. "Critical Metals to Acquire European Lithium." GlobeNewswire, April 27.
[48] Critical Metals Corp. 2026. "Critical Metals Corp. Provides Update on Proposed Acquisition of European Lithium." GlobeNewswire, August 19.
[49] Critical Metals Corp. 2025. Exhibit 99.1 to Form 6-K: Press Release Dated March 31, 2025. US Securities and Exchange Commission.
[50] Mining.com. 2026. "Critical Metals Secures 15-Year Offtake from REalloys." May 21.