
Carbon-Neutral Synthetic Gasoline: Technology, Cost, and the Investment Case
The chemistry has worked since the 1920s. The energy efficiency is 9 to 16%. The cost is 5 to 8x fossil. Airlines, defense, and Porsche are buying it.

Solar DAC-to-Gasoline: Fischer-Tropsch, RFNBO, HIF Global Haru Oni, Climeworks, 45V, ReFuelEU, and the E-Fuels Investment Case
An Integrated Analysis of Technology Readiness, Economics, Policy, and Geopolitics
1. Summary
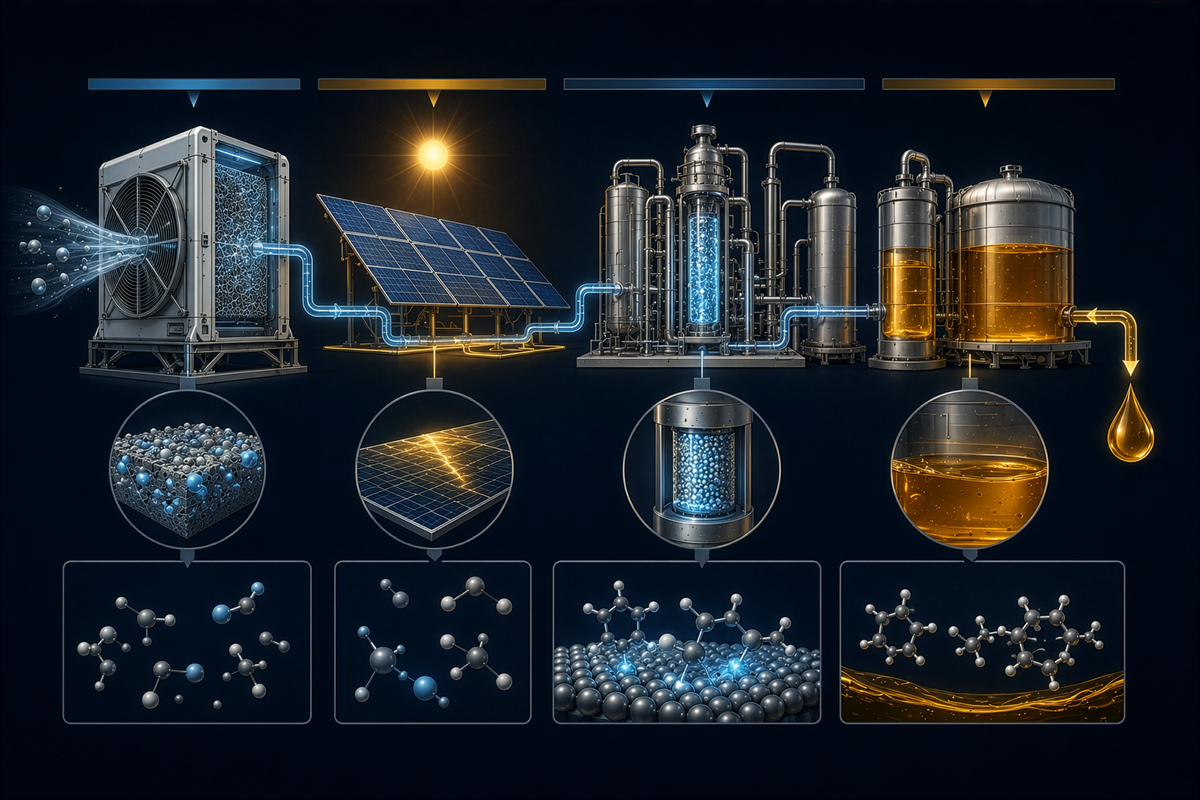
The proposition examined in this report is the production of drop-in gasoline-range hydrocarbons (C5–C12) using three integrated inputs: atmospheric carbon dioxide captured via direct air capture (DAC), hydrogen generated from water electrolysis powered by solar electricity, and catalytic conversion through Fischer-Tropsch synthesis (FT), the methanol-to-gasoline pathway (MTG), or direct CO₂ hydrogenation. The output is chemically indistinguishable from petroleum-derived gasoline and is therefore compatible with the existing internal combustion engine (ICE) fleet, the petroleum distribution network, and prevailing refueling infrastructure. The question is not whether the underlying chemistry works (it does, and has at industrial scale since the 1920s) but whether the integrated system can be deployed at the cost, scale, and carbon intensity that policy frameworks, capital markets, and end-users require.
The strategic outlook is best characterized as one of constrained promise. Solar-powered DAC-to-fuels can deliver near-fossil-equivalent gasoline with a substantially reduced life-cycle carbon footprint, but the levelized cost of production at scale is presently estimated by the International Energy Agency and independent analyses to range from approximately 3.5 to 8 USD per gasoline-equivalent liter, several multiples above prevailing fossil benchmarks even when wholesale crude prices are elevated [1][2][3]. Cost reduction trajectories through 2035 and 2050 are highly sensitive to three exogenous variables: the levelized cost of solar electricity in premium-resource locations, the capital cost trajectory of alkaline and proton-exchange-membrane (PEM) electrolyzers, and the energy intensity and capital cost of DAC, which remains the least mature element of the chain.
Five findings carry strategic weight. First, the round-trip energy efficiency of converting solar electricity to liquid hydrocarbon fuel, measured as the higher heating value of the fuel divided by the electrical energy consumed, is consistently estimated at between 9 and 16 percent in the peer-reviewed and grey literature [4][5][6]. This compares unfavorably with the well-to-wheel efficiency of battery electric vehicles (60 to 75 percent on a primary-electricity basis) and hydrogen fuel cell vehicles (22 to 30 percent), implying that synthetic gasoline is an inefficient vector for delivering renewable energy to road transport. Its strategic case rests on applications where direct electrification is impractical, principally aviation, marine, defense, motorsport, and the management of the legacy ICE fleet during the transition.
Second, the carbon-neutrality claim depends on rigorous life-cycle accounting. When CO₂ is captured from the atmosphere and the hydrogen and process heat are supplied from genuinely additional renewable electricity, the resulting fuel can approach net-zero life-cycle emissions, with residual emissions arising from construction materials, sorbent degradation, and supply-chain inputs. If captured CO₂ is sourced from biogenic point sources rather than the atmosphere, or if grid electricity with a non-zero carbon intensity is used, the fuel may be low-carbon but not credibly carbon-neutral. The European Union's Renewable Energy Directive III and the U.S. Treasury's guidance on the Inflation Reduction Act's 45V hydrogen credit and 45Z clean fuel credit have each established stringent additionality and temporal-matching tests that materially affect project economics [7][8][9].
Third, the regulatory environment is bifurcating. The EU has adopted a strong framework supporting renewable fuels of non-biological origin (RFNBOs), including the so-called e-fuels exemption in the 2035 ICE phaseout, mandatory sub-targets in ReFuelEU Aviation, and contracts-for-difference auctions under the Innovation Fund. The U.S. supports the chain through production tax credits but has not adopted mandates of comparable bindingness. Japan and South Korea are positioning as importers of synthetic fuels. Chile, Saudi Arabia, Namibia, Morocco, and Australia are positioning as exporters on the strength of high-quality solar and wind resources. This emerging trade architecture mirrors, but does not replicate, the existing geography of oil and gas trade.
Fourth, the technology readiness of the integrated system varies sharply by component. Solar photovoltaics and alkaline electrolysis are commercial technologies at TRL 9. PEM electrolysis is approaching gigawatt-scale deployment but remains capital-intensive. Solid oxide electrolysis is at TRL 7 to 8. Fischer-Tropsch and MTG are mature, with multiple commercial-scale gas-to-liquids and coal-to-liquids precedents. DAC is the binding constraint: solid-sorbent systems are operating at low thousands of tonnes per year (Climeworks Orca and Mammoth in Iceland), while liquid-solvent systems are advancing to the megatonne scale through projects such as 1PointFive's STRATOS facility in Texas and Carbon Engineering's licensed designs [10][11][12]. The cost of DAC remains contested, with vendor claims of long-run unit costs near 100 USD per tonne CO₂ versus independent assessments suggesting 400 to 600 USD per tonne in current deployments.
Fifth, the principal headwinds are not technical but economic, regulatory, and competitive. The capital intensity of integrated solar-to-fuel plants is high, with publicly reported figures for early commercial-scale projects ranging from 1.5 to 4 billion USD per facility producing roughly 50 to 200 million liters of fuel per year. Project finance is constrained by the absence of long-term offtake at prices sufficient to amortize the investment, which in turn depends on either mandate-driven demand (the EU approach) or sustained carbon pricing well above current levels. The opportunity cost of renewable electricity, when grids in many jurisdictions remain carbon-intensive, is a substantive critique that the literature has not fully resolved.
The headline recommendations of this report are as follows. Institutional investors should treat solar DAC-to-gasoline as a high-conviction, long-duration thematic exposure with binary regulatory dependencies, and should structure participation through diversified vehicles or partnerships with technology integrators rather than single-asset bets. Corporate strategy executives at energy and mobility firms should establish optionality positions through equity stakes, offtake agreements, and joint development arrangements without committing to single-pathway dependence ahead of cost convergence signals. Policymakers seeking to accelerate deployment should prioritize binding sectoral mandates with phased increases, contracts-for-difference for early projects, and harmonized carbon accounting frameworks; broad-based subsidies without demand-side anchors are unlikely to mobilize private capital at scale. Procurement officers at airlines, defense ministries, and shipping lines should negotiate multi-year, indexed offtake agreements now, while supply is scarce and producers value bankable demand more than premium pricing.
Carbon-Neutral Synthetic Gasoline via Solar-Powered Direct Air Capture: A Strategic and Technical Assessment
1. Summary
- 1.1 The investment question in mid-2026
- 1.2 Where the technology actually stands
- 1.3 Capital flows and partnerships
- 1.4 The three most consequential risks
- 1.5 Strategic implications
2. Contextual Background and Technology Definition
- 2.1 Definitional clarity and the “solid-state” marketing problem
- 2.2 Limitations of conventional lithium-ion that motivate the SSLB pursuit
- 2.3 Research lineage from the 1970s
- 2.4 Why the architectural distinction matters commercially
3. Key Players and Stakeholder Landscape
- 3.1 The four publicly listed pure-plays
- 3.2 The incumbent battery majors
- 3.3 Automotive OEM partnerships
- 3.4 National laboratory and academic centres
- 3.5 Public-sector funding architecture
4. Technical and Operational Considerations
- 4.1 Energy density: claimed versus verified
- 4.2 Cycle life, fast charging and operating windows
- 4.3 Manufacturing scalability
- 4.4 Stack pressure and lithium metal integration
- 4.5 Yield and pilot-versus-gigafactory economics
- 4.6 The disclosure gap
5. Economic and Market Dynamics
- 5.1 Cost benchmarks and the moving target
- 5.2 Market sizing and analyst divergence
- 5.3 Bill of materials versus NMC and LFP
- 5.4 Capex requirements
- 5.5 Addressable market segmentation
- 5.6 Demand-side signals
6. Regulatory and Standards Landscape
- 6.1 Transport classification and the UN 38.3 framework
- 6.2 Performance and safety standards
- 6.3 EU Battery Regulation (Regulation (EU) 2023/1542)
- 6.4 EU Critical Raw Materials Act
- 6.5 End-of-life and recycling
- 6.6 How solid electrolytes may alter regulatory treatment
7. Geopolitical and Strategic Dimensions
- 7.1 Critical mineral dependencies
- 7.2 The U.S. industrial-policy stack
- 7.3 European industrial policy
- 7.4 Japanese and Korean industrial strategy
- 7.5 Export controls
- 7.6 Patent landscape
- 7.7 Defence applications
8. Risk Matrix and Hazard Assessment
- 8.1 Technology risk
- 8.2 Commercial risk
- 8.3 Supply chain risk
- 8.4 Regulatory risk
- 8.5 Operational and safety risks during installation and field use
- 8.6 Reputational and litigation risk
- 8.7 Summary risk matrix interpretation
9. Strategic Recommendations
-
9.1 Recommendations for institutional investors and asset allocators
- 9.1.1 Position sizing and volatility expectation
- 9.1.2 Liquidity-runway gating discipline
- 9.1.3 Indirect exposure through incumbents and materials
- 9.1.4 Avoid the partner-concentration trap
- 9.1.5 SPAC-vintage caution applied to the Factorial transaction
- 9.1.6 Time horizon and rebalancing
- 9.1.7 Specific allocation framework
-
9.2 Recommendations for national-level industrial policy makers
- 9.2.1 Build process IP rather than only mineral capacity
- 9.2.2 Coordinate the trans-Atlantic standards architecture
- 9.2.3 Use defence procurement as anchor demand
- 9.2.4 Avoid premature gigafactory subsidisation
- 9.2.5 Manage the disclosure environment
10. References
2. Context and Background
2.1 The decarbonization challenge for liquid transportation fuels
Liquid hydrocarbon fuels account for approximately 95 percent of final energy consumption in global transport, with road transport, aviation, and shipping consuming around 44, 8, and 11 million barrels of oil equivalent per day respectively in 2024 according to the International Energy Agency [1]. The combustion of these fuels generated approximately 7.7 gigatonnes of carbon dioxide in 2023, roughly 21 percent of energy-related CO₂ emissions globally [1]. Decarbonizing this sector is therefore neither a marginal nor an optional element of any credible climate strategy aligned with the temperature goals of the Paris Agreement.
Two structural features distinguish liquid fuels from electricity and gaseous fuels and shape the decarbonization problem. The first is energy density. Conventional gasoline carries approximately 34 megajoules per liter and 46 megajoules per kilogram, values that contemporary lithium-ion battery packs match in terms of system-level energy density only at substantial weight and cost penalty, and that compressed or liquid hydrogen approach only with significant volumetric overhead. For long-haul aviation and deep-sea shipping, no near-term alternative to liquid hydrocarbons can match the operational envelope of jet fuel and bunker fuel without fundamental redesign of vehicles and infrastructure. The second is durability of installed capital. The global passenger vehicle fleet exceeds 1.4 billion units; the commercial aircraft fleet exceeds 28,000 in-service units with average ages of 12 to 14 years; and the merchant marine fleet exceeds 100,000 vessels. Even aggressive electrification scenarios leave hundreds of millions of internal combustion vehicles operating into the 2040s and tens of thousands of aircraft and ships into the 2050s.
These structural facts create a defensible role for carbon-neutral liquid fuels, but they do not by themselves establish that synthetic e-fuels are the optimal solution. Sustainable aviation fuel (SAF) from biogenic feedstocks, biofuels from advanced lignocellulosic pathways, and ammonia or methanol as direct marine fuels each compete with synthetic gasoline and synthetic kerosene for the same decarbonization budget. The case for solar DAC-to-fuels must therefore be assessed not in isolation but against a portfolio of alternatives, each with its own technological, economic, and political constraints.
2.2 Historical development of synthetic fuels
The chemistry underlying synthetic gasoline is not novel. The Fischer-Tropsch process was developed by Franz Fischer and Hans Tropsch at the Kaiser Wilhelm Institute in Mülheim during the 1920s and was deployed at industrial scale in Germany during the Second World War to address strategic petroleum shortages, with peak production reaching approximately 124,000 barrels per day in 1944 across roughly two dozen plants [13]. The technology was further developed by Sasol in South Africa from the 1950s onward, originally as a response to apartheid-era oil embargoes; Sasol's Secunda complex remains one of the largest synthetic fuel facilities in the world, producing liquid hydrocarbons from coal-derived syngas at a scale of approximately 160,000 barrels per day [13][14].
The methanol-to-gasoline pathway was developed by Mobil (now ExxonMobil) in the 1970s in response to the oil price shocks of that decade. The first commercial-scale MTG plant was constructed in New Zealand in 1985, converting natural-gas-derived methanol to gasoline at a capacity of approximately 14,500 barrels per day; it operated as a fuel producer until the late 1990s before being converted to methanol-only production [15]. The catalytic principle, the conversion of methanol over an acidic zeolite catalyst (typically ZSM-5) to a mixture of light olefins and aromatics in the gasoline boiling range, has been refined continuously since.
What distinguishes contemporary power-to-liquids initiatives from these historical antecedents is not the synthesis chemistry but the carbon and energy inputs. In the German wartime and Sasol cases, the syngas (a mixture of CO and H₂) was produced from coal; in the New Zealand MTG case, methanol was produced from natural gas. The carbon was fossil, and the process emitted approximately as much CO₂ as conventional petroleum refining or more. The contemporary innovation is the substitution of atmospheric CO₂ and water-derived hydrogen for fossil syngas, which alters the life-cycle carbon profile fundamentally if and only if the energy inputs are themselves low-carbon. The first commercial demonstration of solar-powered synthetic gasoline at meaningful scale, HIF Global's Haru Oni facility in southern Chile, began operations in late 2022 with a nameplate capacity of approximately 130,000 liters of synthetic gasoline per year, using wind-derived hydrogen and CO₂ from a commercial point source rather than DAC [16].
2.3 Definitions and taxonomy
Precise terminology is essential because the regulatory and commercial implications of different fuel categories diverge sharply. The term e-fuel refers to a synthetic hydrocarbon or oxygenated fuel produced from CO₂ and hydrogen, where the hydrogen is generated by water electrolysis using renewable electricity. The EU's Renewable Energy Directive III formalized this category under the heading renewable fuels of non-biological origin, or RFNBOs, with specific additionality, temporal correlation, and geographic correlation requirements for the underlying electricity supply [7]. A synfuel is a broader term encompassing any synthetically produced liquid fuel, including those derived from fossil feedstocks via FT or MTG. Drop-in fuel denotes a synthetic fuel that is chemically equivalent or substantially similar to a conventional fuel and can be used in existing engines and infrastructure without modification; synthetic gasoline produced via FT or MTG is drop-in in this sense.
The carbon-accounting taxonomy is more contested. Carbon-neutral typically refers to a product or activity whose net life-cycle CO₂ emissions are zero, with biogenic or atmospheric CO₂ uptake balancing combustion emissions. Net-zero is often used interchangeably with carbon-neutral but more frequently refers to an entity-level or jurisdictional balance including offsets and removals. Carbon-negative or net-negative refers to a product or activity whose deployment results in a net removal of CO₂ from the atmosphere; synthetic gasoline cannot be net-negative if it is combusted, since the captured CO₂ is returned to the atmosphere, although coupled DAC plus permanent geological storage of a fraction of the captured CO₂ can confer net-negative attributes on a portfolio basis. The term low-carbon is used loosely; for the purposes of this report, it denotes a fuel with life-cycle emissions at least 70 percent lower than the fossil baseline, consistent with the RED III threshold for RFNBOs [7].
2.4 The role of solar primary energy and the rationale for DAC
Solar photovoltaic generation is the principal candidate for the primary energy input because it offers the lowest levelized cost of electricity in high-resource locations (estimates from IRENA place utility-scale solar at 30 to 60 USD per megawatt-hour in 2023, with further declines projected) and because suitable land is widely available in arid regions that overlap with the geographies most plausibly attractive for e-fuels export [17]. Wind, hydropower, and geothermal each play complementary roles in specific geographies, but solar's combination of cost, modularity, and geographic distribution is unmatched.
The choice of DAC over point-source carbon capture is consequential and not always made explicit. Point-source capture from industrial facilities (cement plants, ammonia plants, ethanol plants, power stations) offers CO₂ at concentrations of 5 to 95 percent at costs reportedly in the range of 15 to 120 USD per tonne, far below current DAC costs [18][19]. For a synthetic fuel to qualify as carbon-neutral under most accounting frameworks, however, the CO₂ must be of biogenic or atmospheric origin; fossil point-source CO₂ used in fuel production results in a single net combustion of fossil carbon, not zero. The EU's RED III explicitly limits the eligibility of fossil point-source CO₂ for RFNBO accounting after a transition period [7]. The strategic rationale for DAC is therefore not technical efficiency but regulatory and reputational integrity; it is the only carbon source that scales indefinitely and that supports an unambiguous carbon-neutral claim.
3. Technical and Operational Considerations
3.1 Direct air capture technologies
DAC technologies separate into two principal families. Solid-sorbent DAC uses amine-functionalized solids, metal-organic frameworks, or alkaline-impregnated structures that adsorb CO₂ from air at near-ambient temperatures and release it upon heating to between 80 and 120 degrees Celsius, often under partial vacuum. This family includes the systems developed by Climeworks (Switzerland), Heirloom (United States, using calcium-oxide-based mineralization), Global Thermostat, and several emerging entrants. The thermal energy requirement is reported by Climeworks at approximately 1,500 to 2,000 kilowatt-hours-thermal per tonne of CO₂, supplemented by 200 to 400 kilowatt-hours-electric per tonne for fans and ancillary equipment [10][20].
Liquid-solvent DAC, by contrast, uses an aqueous hydroxide solution (typically potassium or sodium hydroxide) to absorb CO₂ in a contactor, followed by a causticization and calcination loop that regenerates the solvent and releases concentrated CO₂. The thermal regeneration occurs at approximately 900 degrees Celsius in a calciner, which is conventionally fueled by natural gas with CO₂ co-capture, but can in principle be electrified or fueled by hydrogen. Carbon Engineering, now a subsidiary of Occidental Petroleum, is the principal proponent of this approach. Total energy requirements per tonne of CO₂ captured are reported in the range of 1,500 to 2,500 kilowatt-hours-thermal-equivalent depending on configuration [11][21].
The implications for solar integration differ. Solid-sorbent systems with lower-temperature regeneration can in principle be powered entirely by solar electricity coupled with electric heating or heat pumps, although capacity factor losses from intermittent operation are substantial because the sorbent regeneration cycle is not instantaneous. Liquid-solvent systems with high-temperature calcination are more thermally demanding and are better suited to continuous baseload operation, which in solar-only configurations requires substantial thermal energy storage (for instance, molten salt) or hybridization with green hydrogen as a process fuel. The capital intensity of currently deployed systems is publicly reported in the range of 600 to 1,200 USD per tonne CO₂ per year of nameplate capacity for solid-sorbent designs and lower per-tonne figures for liquid-solvent designs at megatonne scale, though independent verification of these figures is limited and they remain contested in the academic literature [22][23].
3.2 Solar-powered hydrogen production
Water electrolysis splits H₂O into H₂ and O₂ using electrical energy. Three technologies dominate. Alkaline electrolysis (AEL) is the mature incumbent, with commercial deployments since the early twentieth century in fertilizer and chlor-alkali applications. It uses a potassium hydroxide electrolyte and nickel-based electrodes, operates at 60 to 80 degrees Celsius, and achieves system-level electrical efficiencies of 60 to 70 percent on a higher-heating-value basis. Capital costs in 2024 are reported in the range of 500 to 1,000 USD per kilowatt for large-scale Chinese and European systems, with multiple analyses projecting reductions to 200 to 400 USD per kilowatt by 2030 [24][25].
Proton-exchange-membrane (PEM) electrolysis uses a solid polymer electrolyte and noble-metal catalysts (platinum, iridium). It offers higher current density, faster response to variable load, and a smaller physical footprint than alkaline, but at higher capital cost (typically 800 to 1,800 USD per kilowatt in 2024) and with materials supply constraints, particularly for iridium [24][26]. Its dynamic-response characteristics make it well-suited to direct coupling with solar PV, which presents an intermittent and variable input.
Solid-oxide electrolysis (SOEC) operates at 700 to 850 degrees Celsius and offers higher electrical efficiencies, up to 80 to 90 percent on a higher-heating-value basis if waste heat from downstream processes is recovered for steam generation. It is at TRL 7 to 8 with several demonstration deployments below 10 megawatts, including by Sunfire (Germany), Topsoe (Denmark), and Bloom Energy (United States). SOEC is thermodynamically attractive for integration with FT synthesis, which generates substantial waste heat at temperatures suitable for steam supply, but its dynamic-response limitations and stack-degradation profiles remain active research areas [27][28].
Capacity factor is the critical economic variable. Solar PV in premium locations achieves capacity factors of 25 to 32 percent without storage. An electrolyzer running at this capacity factor amortizes its capital cost over far fewer operating hours than one running at baseload, which raises levelized hydrogen costs materially. Three architectural responses exist: oversizing the solar array relative to the electrolyzer (which curtails some generation but increases electrolyzer capacity factor); hybridizing with wind or grid power; or coupling with hydrogen storage to allow continuous downstream operation. Each has cost implications that propagate through the entire fuel-production chain.
3.3 Fuel synthesis pathways
Three principal routes convert CO₂ and H₂ into gasoline-range hydrocarbons. The reverse water-gas shift (RWGS) followed by Fischer-Tropsch is the most established. RWGS converts CO₂ and H₂ to CO and water at temperatures of 500 to 900 degrees Celsius over various catalysts. The resulting syngas (CO plus residual H₂) is then routed through a Fischer-Tropsch reactor, where cobalt or iron catalysts polymerize the CO into a distribution of hydrocarbons described by the Anderson-Schulz-Flory distribution, with the chain-length distribution controlled by catalyst formulation and reaction conditions [13][29]. The raw FT product is a mixture of paraffins and olefins ranging from C1 (methane) to C100+ (waxes); to maximize gasoline-range yield, the heavier fractions are hydrocracked, and the entire output is hydrotreated and fractionated in a manner analogous to conventional refining. Carbon efficiency from CO₂ to gasoline-range hydrocarbons in integrated RWGS-FT systems is typically reported at 50 to 70 percent, with the remainder appearing as methane, LPG, diesel-range, or wax products [4][30].
Direct CO₂ hydrogenation to hydrocarbons combines RWGS and FT-like polymerization in a single reactor or reactor train, often using modified iron-based catalysts. This approach offers process intensification and capital savings but is at an earlier stage of commercial development and currently faces selectivity challenges, with methane and short-chain byproducts representing a larger share of output than is desirable for gasoline production [31].
The methanol-to-gasoline pathway proceeds via two stages. First, CO₂ and H₂ are converted to methanol over a copper-zinc-aluminum-oxide catalyst at approximately 200 to 300 degrees Celsius and 50 to 100 bar, with carbon efficiency to methanol typically 85 to 95 percent. Second, methanol is dehydrated and converted over a ZSM-5 zeolite catalyst to a mixture of aromatics, isoparaffins, naphthenes, and olefins in the gasoline boiling range, with typical liquid product yields of 85 to 90 percent of methanol carbon [15][32]. The MTG pathway delivers a product with higher aromatic content and octane than typical FT gasoline; it requires additional processing if used in applications where benzene content is regulated.
The choice among these pathways is shaped by product specification, scale, and integration considerations. FT is most appropriate when middle distillates (jet, diesel) are co-products of value, since it produces a broad slate. MTG is most appropriate when gasoline is the dominant target product and aromatic content is acceptable. Direct CO₂ hydrogenation may eventually offer cost advantages but is not yet commercial at meaningful scale.
3.4 System integration and intermittency management
Integrated solar-DAC-electrolysis-synthesis plants face an intermittency problem that does not appear in any single component. Solar electricity is variable on diurnal and seasonal timescales. Electrolyzers can ramp, particularly PEM systems, but at efficiency penalties. DAC is energy-intensive but can in principle be operated cyclically, with sorbent regeneration timed to coincide with peak solar output. Fischer-Tropsch and methanol synthesis reactors, by contrast, are conventionally operated at steady state; cycling imposes thermal stress on catalysts and substantially degrades performance and lifetime. The integration problem is therefore one of buffering: how to feed a steady-state synthesis loop from an intermittent primary energy source.
Three buffering strategies are in use or under development. Hydrogen buffering uses pressurized or geological storage to decouple electrolyzer operation from synthesis. The capital cost is moderate (gaseous storage at 200 to 700 bar costs in the range of 500 to 1,000 USD per kilogram of H₂ storage capacity in surface vessels, far less for salt-cavern storage where geology permits), but the round-trip energy penalty is small [33]. Battery buffering is appropriate for short-duration smoothing of solar output but is too costly for the durations required to support continuous synthesis from solar-only inputs. Thermal energy storage, particularly molten-salt systems, is well-suited to providing the thermal regeneration energy for liquid-solvent DAC and process heat for high-temperature operations. Hybrid renewable resource portfolios, combining solar with wind in geographies where the diurnal and seasonal profiles are anti-correlated, can raise effective capacity factor and reduce the volume of storage required.
Practical integrated designs in the demonstration phase commonly oversize the solar array relative to the electrolyzer (by factors of 1.5 to 2.5), include several hours of hydrogen buffering, and operate the synthesis loop at a steady reduced load that the system can sustain through nominal solar variability. Maintenance and turnaround windows are scheduled during seasonal solar minima. The penalty is capacity factor at the synthesis unit, typically in the range of 60 to 80 percent in solar-rich locations, against the 90 to 95 percent achievable in conventional fossil-fed plants.
3.5 Land, water, and materials intensity
The physical footprint of solar-powered synthetic gasoline is substantial. Producing one barrel of gasoline (approximately 159 liters, with an energy content of roughly 5.4 gigajoules) from CO₂ and water requires, on a thermodynamic minimum basis, approximately 320 kilograms of CO₂, 50 kilograms of H₂, and 450 kilograms of water for the hydrogen feed, with actual process consumption running 20 to 40 percent above the stoichiometric minimum. The electrical energy required, including all losses across DAC, electrolysis, and synthesis, is estimated by Concawe, IEA, and Fraunhofer analyses at 30 to 55 megawatt-hours per barrel of synthetic gasoline equivalent [4][5][34].
Translated to land area for solar PV at a representative capacity factor of 27 percent in a high-irradiance location, this implies approximately 12 to 25 hectares of solar array per barrel-per-day of sustained production, or roughly 12,000 to 25,000 hectares (120 to 250 square kilometers) per facility producing 10,000 barrels per day, which is itself only a small refinery by petroleum-industry standards. Water consumption, including electrolysis feed, cooling, and process water for DAC, is reported in the range of 1.5 to 3 cubic meters per barrel of synthetic gasoline produced, an order of magnitude higher than conventional refining but comparable to some biofuels [35].
Critical-materials intensity is significant for electrolyzers (iridium and platinum in PEM, nickel and stainless steel in alkaline), DAC sorbents (amine functionalization, calcium for liquid-solvent systems), and FT/MTG catalysts (cobalt, iron, zeolite materials). The platinum group metal requirement for PEM electrolyzers in particular has been flagged by the International Energy Agency as a potential supply constraint at multi-hundred-gigawatt scales of deployment [25][36].
3.6 Technology readiness levels and benchmark projects
TRL assessments for the integrated system depend on definitional choices. The constituent technologies are mature: solar PV (TRL 9), alkaline electrolysis (TRL 9), PEM electrolysis (TRL 8 to 9), FT synthesis (TRL 9), methanol synthesis (TRL 9), MTG (TRL 8 to 9 given limited recent commercial deployments). DAC is the limiting component, at TRL 7 to 8 for solid-sorbent systems based on Climeworks Orca (4,000 tonnes CO₂ per year, operational since 2021) and Mammoth (36,000 tonnes per year, operational since 2024) [10]. Heirloom's first commercial plant in Tracy, California opened in 2023 at approximately 1,000 tonnes per year [37]. Liquid-solvent DAC at megatonne scale is under construction, with 1PointFive's STRATOS plant in Ector County, Texas designed for 500,000 tonnes per year initial capacity and targeted for operation in 2025 [12].
The integrated solar-to-fuel system is best characterized as TRL 7. HIF Global's Haru Oni plant in Punta Arenas, Chile is the leading demonstration; it began producing synthetic gasoline in late 2022 at approximately 130,000 liters per year (roughly 2.2 barrels per day), using wind rather than solar primary energy and a fossil point-source CO₂ supply rather than DAC [16]. Norsk e-Fuel is developing a power-to-liquids facility in Mosjøen, Norway, with an initial-phase capacity of approximately 12.5 million liters per year of synthetic jet, gasoline, and diesel, targeting first production in 2026 with CO₂ from biogenic point sources [38]. Infinium has begun commercial-scale operations at its Project Roadrunner facility in Texas using captured CO₂ and renewable hydrogen to produce synthetic fuels and waxes, with operational beginning in 2024 [39]. Twelve operates a commercial-scale electrolyzer plant in Moses Lake, Washington, producing synthetic kerosene (E-Jet) primarily for aviation offtake [40]. Prometheus Fuels, an earlier-stage entrant, has been pursuing a distinct electrochemical pathway combining CO₂ capture and conversion but has not, as of publicly available reporting, achieved commercial-scale operation [41].
These projects collectively establish the technical viability of the chain but do not yet demonstrate the cost trajectory that mainstream adoption requires. The next five years will produce the first commercial-scale data points on integrated capital cost, operational availability, and unit economics at production rates of tens of thousands of tonnes per year, which is the necessary foundation for any defensible 2030s scaling analysis.

4. Key Players and Stakeholders
4.1 Technology developers and integrators
The technology landscape comprises three layers: component specialists, integrators, and vertically integrated developers. In DAC, Climeworks (Switzerland), Heirloom (United States), Global Thermostat (United States), Carbon Engineering (Canada, owned by Occidental), 1PointFive (United States, an Occidental subsidiary), CarbonCapture Inc. (United States), and AirCapture (United States) are the principal commercial-stage developers, with multiple early-stage entrants pursuing alternative sorbent chemistries, electrochemical capture, and ocean-based approaches [10][11][37][42]. In electrolysis, Nel ASA (Norway), Plug Power (United States), Cummins (acquired Hydrogenics), thyssenkrupp (Germany), McPhy (France), ITM Power (United Kingdom), Sunfire (Germany), Topsoe (Denmark), and a growing roster of Chinese manufacturers (Longi Hydrogen, Sungrow, LONGi Green Energy among others) supply commercial alkaline and PEM systems, with the Chinese share of global manufacturing capacity having grown rapidly between 2022 and 2025 [25][43].
In synthesis, Sasol (South Africa), Topsoe, Johnson Matthey (United Kingdom), and Shell maintain Fischer-Tropsch and methanol-synthesis technology portfolios. ExxonMobil holds the foundational MTG patents and licenses the technology selectively. Catalyst suppliers including BASF, Clariant, and Johnson Matthey provide the FT and methanol catalysts and the zeolites underpinning MTG.
Vertically integrated developers attempt to assemble the chain into project entities. HIF Global, originally a Chilean venture supported by Porsche, AME, ENAP, and Siemens Energy, is the most prominent, with the Haru Oni demonstration plant and proposed commercial expansions in Chile, the United States (Matagorda County, Texas), Tasmania, and Uruguay [16][44]. Norsk e-Fuel (a consortium including Sunfire, Climeworks, and Paul Wurth) operates in the Nordic region. Infinium, backed by Breakthrough Energy Ventures and others, has deployed at commercial scale in Texas and announced projects in the Permian Basin and Australia [39]. Twelve, which uses a distinct electrochemical CO₂-to-CO conversion technology coupled with downstream FT, operates from Moses Lake [40]. Synhelion (Switzerland) pursues a thermochemical solar-driven pathway that bypasses water electrolysis [45]. Prometheus Fuels and a long tail of early-stage entrants complete the field.
4.2 Energy majors and refiners with active e-fuels programs
Among integrated oil majors, the most active in e-fuels are Occidental (through its acquisition of Carbon Engineering and the 1PointFive DAC platform), ExxonMobil (through MTG licensing and active research in low-carbon fuels at its Baytown and Strathcona facilities), Shell (through participation in the Haru Oni project and broader power-to-liquids research), TotalEnergies (through investment in Sunfire, partnership with Masdar, and various biofuel-adjacent activities), Equinor (through hydrogen-focused investments), and Saudi Aramco (through MoUs with Repsol on synthetic fuels and through participation in the Saudi green hydrogen export agenda) [12][46]. Repsol has invested in synthetic fuels at its Bilbao site, including a methanol-to-gasoline demonstration with Aramco. Eni operates biorefineries that could in principle be adapted for synthetic-fuel co-processing.
Independent refiners with active synthetic-fuel exposure include Phillips 66 (through co-processing activities), Marathon (via Martinez and Dickinson renewable diesel conversions, though primarily biofeedstock-based), and Neste (the global leader in renewable diesel with developing power-to-liquids interest). The pattern is one of optionality positioning rather than committed capital, with publicly disclosed e-fuel investment by the integrated majors representing a small fraction of total downstream capital expenditure as of 2025.
4.3 Offtake partners
Demand-side participation has been driven by aviation and motorsport more than by road transport, reflecting the relative cost-tolerance of these segments. In aviation, sustainable aviation fuel offtake agreements covering synthetic kerosene from power-to-liquids facilities have been announced by Lufthansa, KLM, IAG, United Airlines, Delta, Southwest, JetBlue, Boeing, Airbus, and the U.S. and U.K. defense departments, with total announced volumes through 2030 estimated by industry trackers at several billion liters cumulatively [47][48]. The economic structure typically combines a base offtake price near or below the prevailing SAF market plus a green premium attached to a portion of the volume.
In motorsport, Formula 1 has committed to a fully sustainable fuel by 2026, with synthetic and advanced biofuel pathways under development by Aramco, Shell, ExxonMobil, and Petronas in partnership with the FIA. The World Rally Championship adopted synthetic and advanced biofuels from 2022, supplied by P1 Performance Fuels. Porsche's stake in HIF Global is partly motivated by the requirements of its motorsport and classic-car businesses [16][44].
In automotive, the e-fuels exemption negotiated by Germany and Italy in the EU's 2035 ICE phaseout is intended to preserve a regulatory pathway for ICE vehicles fueled exclusively by RFNBOs after 2035. The commercial implications remain uncertain because the volumes required to sustain a 2030s ICE fleet at scale on synthetic fuels exceed announced supply by one to two orders of magnitude, and because consumer pricing tolerance for premium-priced fuel at scale has not been tested [49].
4.4 Public sector institutions and funding bodies
Public funding for the chain comes from multiple instruments. The U.S. Department of Energy's Office of Clean Energy Demonstrations has committed substantial funding to four Regional DAC Hubs (totaling approximately 3.5 billion USD over the lifetime of the program), to seven Regional Hydrogen Hubs (approximately 7 billion USD), and to broader low-carbon fuels initiatives [50][51]. The Inflation Reduction Act of 2022 introduced or expanded the 45Q tax credit for carbon sequestration (up to 180 USD per tonne for DAC with permanent storage), the 45V production tax credit for clean hydrogen (up to 3 USD per kilogram, with tiered eligibility based on life-cycle carbon intensity), and the 45Z clean fuel production credit, each with distinct rule sets and definitional thresholds [8][9].
The European Commission's Innovation Fund has awarded grants to multiple e-fuels projects, with recent rounds funding facilities including Norsk e-Fuel and Carbon2Business [52]. The EU Hydrogen Bank, operating through pilot auctions in 2023 and 2024, provides fixed-premium contracts for renewable hydrogen production, with the second auction reserving a specific allocation for maritime applications [53]. Member-state schemes including Germany's H2Global instrument, which uses a double-sided auction to bridge price gaps between low-carbon hydrogen producers and offtakers, have been used to underwrite cross-border supply arrangements [54].
Japan's METI has funded synthetic-fuel research and demonstration through NEDO grants and has incorporated synthetic fuels into the country's Strategic Energy Plan and Green Growth Strategy with a particular interest in import-based supply [55]. South Korea, the United Kingdom, Australia (through ARENA), Canada (through SDTC and the federal Clean Fuel Regulations), and the Gulf states have each established public funding mechanisms of varying scale, with mandates often tied to national hydrogen strategies.
4.5 Standard-setting organizations and certification bodies
The credibility of carbon-neutral claims depends on third-party certification. The principal voluntary standards are ISCC (International Sustainability and Carbon Certification), with its ISCC EU and ISCC Plus schemes recognized under EU regulations, and the Roundtable on Sustainable Biomaterials (RSB), which has developed dedicated power-to-liquids and e-fuel certification methodologies [56][57]. The CORSIA (Carbon Offsetting and Reduction Scheme for International Aviation) framework, administered by ICAO, sets life-cycle emission thresholds for SAFs eligible to be claimed against airline emissions obligations [58]. The U.S. EPA's Renewable Fuel Standard and the California Air Resources Board's Low Carbon Fuel Standard provide pathway-specific carbon-intensity scoring for fuels marketed in those jurisdictions, with active rule-making on power-to-liquids pathways through 2024 and 2025 [59].
Methodological choices within these frameworks can shift the assessed carbon intensity of synthetic fuels by factors of two or more. The treatment of electricity additionality, biogenic versus atmospheric CO₂, indirect land-use change for any biogenic CO₂ feed, and credit for co-products are each contested in the literature. Investors and procurement officers should treat the certification landscape as a material risk vector, not a procedural detail.
5. Economic and Market Dynamics
5.1 Levelized cost of synthetic gasoline
Estimates of the levelized cost of synthetic gasoline produced from solar primary energy and atmospheric CO₂ vary widely across published sources, reflecting differences in assumed solar LCOE, electrolyzer capital cost, DAC cost, plant scale, capacity factor, and cost of capital. The IEA's 2023 assessment placed the production cost of synthetic kerosene from DAC and renewable hydrogen at approximately 3 to 6 USD per liter of jet-fuel equivalent in current systems, with potential reductions to 1.2 to 2.5 USD per liter by 2050 under favorable cost-down trajectories [1][2]. Concawe's 2021 study, considering European conditions, reported synthetic gasoline production costs in 2030 of approximately 2.5 to 4.5 EUR per liter, with the lower bound conditional on high-resource solar locations and aggressive electrolyzer and DAC cost declines [4]. Recent academic assessments, including work by the Potsdam Institute and ETH Zurich, place 2030 production cost at the plant gate in the range of 1.5 to 3 EUR per liter gasoline-equivalent in the most favorable geographies, rising to 3 to 5 EUR per liter at less favorable sites [60][61].
Three sensitivities dominate. First, solar LCOE: a reduction from 50 to 25 USD per megawatt-hour in the assumed primary energy cost lowers the production cost of synthetic gasoline by approximately 0.6 to 1.0 USD per liter, given the multi-megawatt-hour-per-liter energy intensity of the chain. Second, electrolyzer CapEx: a reduction from 1,000 to 300 USD per kilowatt in installed cost lowers production cost by approximately 0.3 to 0.6 USD per liter under typical assumed capacity factors. Third, DAC cost: a reduction from 600 to 150 USD per tonne CO₂ lowers production cost by approximately 0.4 to 0.8 USD per liter, since each liter of gasoline incorporates roughly 2 kilograms of CO₂. Compounded, these sensitivities can move production cost by a factor of two or more, which explains the wide range of published estimates.
Wholesale fossil gasoline at international refining centers traded in 2024 and early 2025 in a range of 0.50 to 0.80 USD per liter at the rack, before duties and taxes. At retail in major OECD markets, gasoline prices in 2025 spanned 0.70 to 2.20 USD per liter, with the bulk of the variance attributable to fuel taxation [62]. Synthetic gasoline at current production cost is therefore between approximately 4 and 10 times the wholesale fossil price, and between approximately 1.5 and 6 times the retail price depending on jurisdiction and tax regime. Cost parity with fossil at the retail level in high-tax jurisdictions is plausible by 2035 under optimistic assumptions; parity at the wholesale level remains a 2040s-or-beyond proposition under all but the most aggressive scenarios.
5.2 Cost decomposition by stage
Disaggregating the levelized cost of synthetic gasoline into its constituents is useful for prioritizing innovation effort. Under representative current-cost assumptions (solar LCOE at 35 USD per MWh, alkaline electrolyzer CapEx at 800 USD per kW, DAC cost at 450 USD per tonne CO₂, synthesis CapEx at industry-published values, plant operating at 75 percent annual availability with 30 percent solar-array oversizing), the IEA decomposes plant-gate cost approximately as follows: hydrogen production accounts for 50 to 60 percent of total cost, CO₂ capture for 20 to 30 percent, synthesis and upgrading for 10 to 20 percent, and balance-of-plant and operating costs for the remainder [1][2]. As DAC and electrolyzer costs decline over time, the relative share of capital cost of synthesis equipment is expected to rise, which would shift the marginal-improvement calculus toward synthesis-process intensification and integration optimization.
5.3 Comparison with fossil gasoline and competing low-carbon alternatives
Synthetic gasoline competes for the same decarbonization budget against three alternatives. Battery electric vehicles, on a primary-energy basis, deliver more useful service per unit of renewable electricity by a factor of five to seven, with current total cost of ownership for light-duty BEVs at or below ICE parity in major markets when subsidies are included [63]. Hydrogen fuel-cell vehicles, although technically viable, have not achieved meaningful market share in light-duty applications and face infrastructure constraints in heavy-duty applications. Advanced biofuels, including HEFA and synthesized iso-paraffinic fuels from biomass, are competitive on a cost basis (sustainable aviation fuel from HEFA in 2024 was priced approximately 2 to 3 times conventional jet, against the 4 to 6 times multiple for power-to-liquids), but face feedstock-availability constraints at large scale and questions about indirect land-use emissions [47][64].
The strategic positioning of solar DAC-to-gasoline is therefore not as the principal decarbonization vector for road transport, where electrification is preferred on efficiency grounds, but as a defensible solution for aviation, marine, motorsport, defense, and the long-tail legacy ICE fleet, where direct electrification is impractical or where the cost-tolerance of the end use accommodates a price premium.
5.4 Demand forecasts in addressable segments
ReFuelEU Aviation mandates 2 percent SAF in EU aviation fuel by 2025, rising to 6 percent in 2030, 20 percent in 2035, 34 percent in 2040, and 70 percent in 2050, with sub-mandates for synthetic fuels (RFNBOs) of 1.2 percent by 2030 and 35 percent by 2050 [65]. Translated to volume, the EU's RFNBO aviation requirement implies approximately 0.7 to 1 million tonnes per year of synthetic kerosene by 2030, rising to 25 to 35 million tonnes by 2050 [65]. FuelEU Maritime imposes graduated greenhouse-gas intensity reduction targets on shipping fuels used in EU ports, with implicit demand for low-carbon marine fuels including methanol, ammonia, and synthetic distillates [66].
Outside the EU mandate framework, demand for synthetic gasoline specifically is driven by motorsport (small in volume but high in unit value), strategic reserve and defense applications (where energy security considerations apply), and any post-2035 EU passenger-car demand from vehicles operating under the e-fuels exemption. The volumes of synthetic gasoline implied by these sources are far smaller than those implied by aviation. Industry estimates of global e-fuels production capacity announced through 2030 (including all hydrocarbon types) total approximately 1 to 3 million tonnes per year, against IEA Net Zero scenario requirements of approximately 30 to 50 million tonnes per year by 2030 if the scenarios are to be realized [1][67].
5.5 Capital intensity, financing structures, and offtake
Capital intensity for integrated solar-to-fuel facilities is high. Publicly reported capital cost figures for announced commercial-scale projects (production rates of 50 to 200 million liters per year of liquid product) range from approximately 1.5 to 4 billion USD per facility, including solar generation, electrolysis, DAC where included, synthesis, and balance-of-plant [16][38][39]. Project finance has been constrained by the absence of bankable offtake at prices sufficient to support standard project-finance gearing ratios. Equity capital from energy majors, climate-focused funds (Breakthrough Energy Ventures, the Climate Pledge Fund), and corporate strategic investors has therefore predominated.
Three financial-structure innovations are emerging. Contracts-for-difference (CfDs) administered by public bodies provide a fixed reference price for output, with the public counterparty paying the difference between this and the market price (or recovering the difference if market prices exceed the reference). Germany's H2Global, the EU Hydrogen Bank, and the UK's Sustainable Aviation Fuel Mandate revenue-certainty scheme are examples [53][54]. Long-term offtake agreements with airlines, defense ministries, and strategic-reserve programs provide bankable revenue and have been the principal vehicle for de-risking aviation-focused projects. Blended finance combining concessional debt from development banks with private equity and offtake-linked debt is being explored for projects in lower-income solar-rich geographies (Morocco, Namibia, parts of Latin America).
5.6 Learning curves and cost reduction expectations
Cost reduction expectations rest on learning curves derived from analogous technologies. Solar PV has exhibited a learning rate of approximately 24 percent (cost reduction per doubling of cumulative deployment) since the 1970s [17]. Lithium-ion batteries have exhibited learning rates of approximately 18 to 22 percent. Wind turbines have exhibited learning rates of approximately 10 to 15 percent. Electrolyzers are estimated by IEA, IRENA, and academic sources to have learning rates of approximately 10 to 18 percent, with the wide range reflecting the immaturity of large-scale deployment data [24][25][68]. DAC learning rates are essentially unknown, with industry projections (which often assume rates of 15 to 25 percent) substantially exceeding academic assessments that take a more conservative view in the absence of cumulative deployment data.
Applied to the cost decomposition described above, plausible learning rates and capacity-deployment trajectories imply plant-gate production cost reductions of 30 to 60 percent between 2025 and 2035, with further reductions in the 2035-2050 window dependent on the realization of larger deployment volumes and on innovation in DAC and synthesis-process integration. The wide range of credible 2050 cost estimates (0.8 to 2.5 USD per liter at the plant gate in 2050 USD) reflects the underlying uncertainty about whether DAC will deploy at the multi-gigatonne scale required to drive substantial cost-down, which depends in turn on policy commitments that remain partly speculative.
6. Regulatory Landscape
6.1 European Union
The EU has the most developed regulatory architecture for e-fuels. The Renewable Energy Directive III, in force from 2024, defines RFNBOs and establishes the additionality, temporal-correlation, and geographic-correlation tests that electricity used in RFNBO production must satisfy. From 2030, hourly temporal matching is required (with limited transitional flexibility) and the electricity must come from new renewable generation in the same bidding zone (or a directly connected zone) as the production facility [7]. These rules are strict by international standards and have been credited with promoting integrity, criticized as restrictive enough to delay deployment, or both, depending on the analyst.
ReFuelEU Aviation establishes the SAF and RFNBO sub-mandate trajectory for aviation described in section 5.4. FuelEU Maritime applies graduated greenhouse-gas intensity reduction targets to shipping fuels used at EU ports, with multipliers favoring RFNBOs in the early years to support market emergence [66]. The Emissions Trading System, after the 2023 reforms, applies to maritime emissions and to aviation within the European Economic Area, raising the carbon-cost differential between fossil and synthetic fuels in those segments.
The 2035 ICE phaseout under Regulation (EU) 2023/851 nominally bans the sale of new passenger cars with internal combustion engines from 2035, with the e-fuels exemption negotiated in March 2023 preserving a route for new ICE vehicles capable of operating only on carbon-neutral fuels. Implementing rules to operationalize this exemption, including the definition of the vehicle category and the assurance mechanisms for fuel use, are still under development as of mid-2026; the practical importance of the exemption depends entirely on these rules and on the actual availability and price of synthetic fuels [49].
6.2 United States
The U.S. regulatory framework supports the chain primarily through production tax credits rather than mandates. The 45Q credit, expanded by the Inflation Reduction Act, provides up to 180 USD per tonne CO₂ for DAC with permanent geological sequestration and up to 130 USD per tonne for DAC with utilization (which includes use in e-fuels production), subject to wage and apprenticeship requirements [8]. The 45V credit provides up to 3 USD per kilogram of hydrogen at the lowest carbon-intensity tier (below 0.45 kg CO₂e per kg H₂ on a life-cycle basis), tiered down for higher intensities, with Treasury rules finalized in late 2024 establishing additionality, regional matching, and hourly temporal matching requirements broadly aligned with the EU framework but with longer transitional periods [9].
The 45Z clean fuel production credit, in effect from 2025, provides a credit of up to 1 USD per gallon for non-aviation fuels and 1.75 USD per gallon for SAF, scaled by life-cycle carbon-intensity reductions relative to defined baselines [69]. The interaction among 45Q, 45V, and 45Z is not entirely straightforward, with anti-double-counting provisions requiring careful structuring of project economics.
Beyond tax credits, the DOE Hydrogen Hubs (seven regional consortia receiving up to 7 billion USD in combined federal support) and Regional DAC Hubs (with up to 3.5 billion USD committed) provide capital support [50][51]. The California Low Carbon Fuel Standard, Oregon Clean Fuels Program, and Washington Clean Fuel Standard each provide tradable credits for low-carbon fuels in those state markets [59]. The Renewable Fuel Standard administered by EPA has incorporated some power-to-liquids pathways through case-by-case approvals.
6.3 Other jurisdictions
Japan's Basic Hydrogen Strategy (revised 2023) and Strategic Energy Plan target hydrogen and synthetic fuel imports as central pillars of decarbonization, with METI sponsoring multiple bilateral supply development agreements with Australia, the Middle East, and the Americas [55][71]. Synthetic fuels are positioned in the GX (Green Transformation) framework with funding instruments including transition bonds and contracts-for-difference for hydrogen offtake.
South Korea's Hydrogen Economy Roadmap and Korean New Deal include synthetic fuel imports, with state-supported supply development underway in partnership with Saudi Arabia and Australia [72]. Chile's National Green Hydrogen Strategy targets the country becoming a major exporter on the strength of its Patagonian wind resources and Atacama solar resources; HIF Global's Haru Oni project is the leading current asset [16][73]. Saudi Arabia has positioned its NEOM project, with planned green-hydrogen and ammonia output of 1.2 million tonnes per year, as a foundation for synthetic-fuel export potential [74]. Australia's Hydrogen Strategy, supported through ARENA, targets the country as a producer for domestic decarbonization and as an exporter to Japan and Korea [75]. The United Kingdom's Sustainable Aviation Fuel Mandate, in force from 2025, imposes SAF blending obligations with a specific power-to-liquids sub-mandate rising to 3.5 percent of total jet fuel by 2040 [76].
6.4 Carbon accounting methodologies and certification
Three certification frameworks dominate. ISCC EU is recognized under EU Renewable Energy Directive rules and applies to RFNBO compliance verification. RSB has developed a power-to-liquids certification methodology applicable to both ISCC- and CORSIA-compliant fuel claims. CORSIA Eligible Fuels lists, published by ICAO, identify approved pathways and methodologies for SAFs counted against airline CORSIA obligations [56][57][58]. The choice among frameworks is consequential because the assessed carbon-intensity for an identical physical product can differ across frameworks owing to methodological choices about co-product allocation, indirect emissions, and additionality.
Specific methodological flashpoints include the treatment of biogenic point-source CO₂ (eligible in the U.S. and EU under transitional provisions, with phase-out timing under debate), the additionality test for renewable electricity (strict in the EU, more permissive but tightening in the U.S.), and the carbon footprint of DAC inputs (which becomes material as DAC enters the carbon-intensity calculation, particularly for systems requiring substantial natural-gas-derived thermal energy).
6.5 Regulatory risks and pending policy decisions
Three regulatory risks dominate the investment landscape through 2030. First, the durability of EU mandate volumes and sub-mandate sub-allocations: although ReFuelEU and FuelEU are in force, the political durability of the high-decade-2030s sub-mandates depends on supply availability and price visibility, which are not yet established. Second, the resolution of the U.S. 45V additionality and temporal-matching rules, which has been actively contested through 2024 and 2025, with industry, environmental NGOs, and various legislators advocating divergent positions [9][70]. Third, the development of operational rules for the EU 2035 e-fuels exemption, which will determine whether the exemption is a meaningful market opportunity or a regulatory artifact [49]. Resolution of each of these uncertainties will be a meaningful inflection point for project decisions in the relevant geographies.
7. Geopolitical and Strategic Dimensions
7.1 The emerging geography of e-fuels production
The geography of synthetic-fuels production is determined primarily by solar and wind resource quality, secondarily by access to water and to suitable land, and tertiarily by political stability, port access for export, and capital availability. The premium production geographies are: Patagonia (southern Chile and Argentina) for wind-dominated systems with seasonal solar contribution; the Atacama desert and adjacent regions of Chile and Peru for solar-dominated systems; the northwest African coast (Morocco, Western Sahara, Mauritania) for solar with Atlantic export; Namibia and parts of South Africa for solar with combined wind; the Arabian Peninsula (NEOM and the wider Saudi-UAE-Oman region) for solar combined with extensive industrial infrastructure; and northwestern Australia for solar with proximity to Japanese and Korean offtake [73][74][75][77].
The implication is that the prospective e-fuels trade map will resemble the existing LNG trade in topology but with different exporter identities. The United States and Europe will likely be both significant producers (in solar-rich regions of the southwestern U.S. and southern Iberia) and significant importers, with import dependency varying by sector and product. Japan and South Korea will be net importers with strong sponsorship of supplier development. China's role is ambiguous; the country has the manufacturing capacity to dominate electrolyzer and possibly DAC supply, but its position as a fuels producer for export is constrained by its own decarbonization demands.
7.2 Energy security implications for fuel-importing nations
For fuel-importing nations, synthetic fuels offer two strategic benefits relative to petroleum imports: they diversify the supplier set (resource quality is correlated with sunlight, not with sedimentary basin geology) and they offer a credible pathway to net-zero compliance without abandoning the existing liquid-fuel infrastructure. The associated risks include exposure to a new set of supplier-state political and economic risks (Chile, Namibia, Morocco, the Gulf states); the technological dependence on suppliers of electrolyzers and DAC equipment, which is currently concentrated in a small set of countries (Germany, the U.S., China, with rapid Chinese expansion); and the price exposure inherent in long-distance shipping of energy carriers, which is more sensitive to bunker fuel and Suez Canal disruption than is conventional oil trade in the short term.
7.3 Trade flows, port infrastructure, and shipping logistics
Synthetic gasoline is in the same physical and regulatory category as conventional gasoline for transport purposes; it can be moved in the same vessels, stored in the same tanks, and unloaded at the same terminals. This is a substantial commercial advantage relative to alternative low-carbon energy carriers such as liquid hydrogen or ammonia, which require specialized handling infrastructure. The principal commercial questions concern the size and location of export terminals at producing sites (existing port capacity in Patagonia, northwest Africa, and Namibia is limited and would require expansion), the long-distance shipping cost premium for what are likely to be modest cargo volumes initially, and the segregation of synthetic from fossil cargoes for traceability and certification purposes.
7.4 Strategic competition among major powers
Four blocs are pursuing distinct strategies. The European Union has staked the most aggressive mandate-driven demand creation, accompanied by strict integrity rules, with the apparent intent of pulling forward a global industry while ensuring that European producers retain a competitive position. The United States has emphasized production tax credits and innovation investment, with a more permissive integrity framework and a focus on cost reduction through scale, although the durability of these incentives under successive administrations is uncertain. China has emphasized manufacturing leadership in electrolyzers and downstream equipment, with its e-fuels deployment as a fuel producer secondary to its electrolyzer-export ambitions [25][43]. The Gulf states have positioned themselves as production and export hubs, leveraging existing capital availability, fossil-industry expertise, and high-quality solar resources, while preserving optionality across hydrogen, ammonia, methanol, and synthetic hydrocarbons.
The competitive interaction among these blocs is consequential. Strict EU integrity rules combined with limited domestic renewable-electricity availability create a structural import opportunity that exporters compete to fill. U.S. tax credits potentially attract European-origin offtake, raising EU concerns about competitiveness. Chinese electrolyzer competitiveness offers cost-down to all parties but creates supply-chain dependency concerns analogous to those that have constrained Chinese solar PV deployment in some markets.
7.5 Implications for petrostates and the long-term fossil fuel transition
The synthetic-fuels pathway is one of the few low-carbon options that preserves a defensible role for legacy refining, distribution, and retail infrastructure, including assets owned by integrated oil majors and by national oil companies. For petrostates with strong solar resources (Saudi Arabia, the UAE, parts of North Africa, parts of Latin America), the strategic case for active synthetic-fuels positioning is substantial: it offers a hedge against terminal demand decline for petroleum products by transitioning into the supply of chemically-equivalent low-carbon substitutes. For petrostates with weaker solar resources (Russia, Venezuela, Nigeria), the strategic position is more difficult, and these countries may be marginalized in the post-fossil liquid-fuels system. The implications for the long-run political economy of oil are substantial but difficult to forecast with precision.
8. Risk Analysis
The risks attending solar-powered DAC-to-gasoline are sufficiently interdependent that a tabular risk matrix would obscure the causal mechanisms among them. The discussion below is organized by horizon and by category, with explicit identification of dependencies among categories where these are most consequential.
8.1 Short-term horizon (1–3 years, through 2029)
Technical risks in the near term concern the operational performance of first-of-a-kind integrated plants. The cluster of demonstration and early commercial facilities reaching first production in 2025 to 2027 (HIF Global expansion in Texas, Norsk e-Fuel Mosjøen, Infinium scale-up, others) will produce the first publicly disclosed data on integrated capacity factor, unit production cost, product quality, and operational availability. Deviations of 30 to 50 percent below pre-construction projections, which are not uncommon in first-of-a-kind chemical-process plants, would substantially reset both the cost trajectory and the financing market for follow-on facilities. The principal technical risk is not catastrophic failure of any single component but the integration penalty: the difference between component performance under ideal isolated conditions and performance within the dynamics of an integrated, intermittently-loaded system.
Regulatory risks in the near term concern the finalization of U.S. Treasury rules under 45V and 45Z, the operationalization of the EU 2035 e-fuels exemption, and the resolution of ReFuelEU implementing acts. Each of these decisions can shift project-level economics by 0.5 to 2 USD per liter, and combinations of unfavorable outcomes would render announced projects financially marginal. The political durability of EU mandates is itself a near-term consideration if industrial-competitiveness concerns lead to weakening of secondary targets.
Financial risks in the near term concern the availability of debt financing for first-of-a-kind facilities and the willingness of equity providers to fund expansion ahead of demonstrated unit economics. The high-interest-rate environment of 2023 to 2025 has materially raised project-finance costs across the renewable energy sector; e-fuels facilities, with their long construction periods and uncertain offtake-pricing trajectories, are disproportionately affected. Adoption risks are limited in the near term because mandate-driven demand floor sustains the immediate market; competitive risks from rapid EV adoption affect road-transport demand but not the aviation, marine, motorsport, and defense segments where synthetic gasoline and adjacent fuels compete most credibly.
8.2 Medium-term horizon (3–7 years, 2029–2033)
Technical risks in the medium term shift from first-of-a-kind risk to scale-up risk. The transition from facilities producing tens of thousands of tonnes per year to facilities producing hundreds of thousands of tonnes per year (the scale at which competitive economics begin to plausibly emerge) requires DAC, electrolyzer, and synthesis modules that have not yet been deployed at full commercial scale in integrated configurations. Specific concerns include sorbent lifetime under high-throughput cycling, electrolyzer stack lifetime under variable-load conditions, FT catalyst stability under low-CO syngas, and the management of trace impurities through the chain. Resolution of these concerns depends on operating-hours accumulation by the first-of-a-kind plants and on continued R&D investment.
Regulatory risks in the medium term concern the trajectory of carbon pricing in major economies. The economic viability of synthetic fuels at scale depends on either continued mandate-driven offtake at premium prices or carbon prices sufficient to close the gap with fossil at the wholesale level. EU ETS prices in 2024 and 2025 traded in the range of 60 to 90 EUR per tonne CO₂, well below the level required to close the gap with current synthetic-fuel production cost; whether prices rise to the 150 to 250 EUR per tonne range that would materially shift the economics is uncertain and politically contingent [78].
Financial risks in the medium term concern the maturation of project finance for synthetic-fuels facilities. Bank lenders have historically required tested technologies and bankable offtake; the development of credit-rating methodologies, insurance products, and benchmark debt-pricing for e-fuels facilities is a precondition for scaling beyond the current equity-and-public-funding model. Adoption risks intensify in the medium term as the cost trajectory of competing decarbonization options becomes clearer; rapid further cost reduction of batteries and continued growth of electric heavy-duty vehicle adoption could reduce the addressable market for synthetic fuels in surface transport more rapidly than current forecasts assume.
8.3 Long-term horizon (7+ years, post-2033)
Long-term risks are dominated by structural uncertainties about the trajectory of the energy transition and about the political-economic durability of the regulatory frameworks that currently underpin the chain. Technical risks in the long term are dominated by the possibility that alternative decarbonization vectors (advanced biofuels, direct electrification of aviation through battery-electric or hybrid-electric aircraft for short-haul, hydrogen-fueled aviation for medium-haul, ammonia for marine) capture share that would otherwise have flowed to synthetic hydrocarbons. The technology-S-curves of these alternatives are not yet sufficiently mature to forecast with confidence, but several of them have the potential to displace meaningful volumes of synthetic-fuel demand in the 2040s and 2050s if their cost-down trajectories are favorable.
Regulatory risks in the long term concern the durability of the mandate frameworks themselves. Mandates that impose substantial cost premiums on essential fuels are politically vulnerable, particularly under economic stress or political-party turnover. The 2050 RFNBO sub-mandate of 35 percent of EU aviation fuel implies a sustained political consensus over 25 years that is not yet demonstrated. Financial risks in the long term concern the capital intensity of a global transition that may require terawatts of solar generation and gigatonnes of annual DAC capacity if synthetic fuels are to substitute for a meaningful fraction of fossil liquid fuel use. The associated capital mobilization, in the range of trillions of dollars cumulatively, requires sustained policy commitment and supportive macroeconomic conditions that cannot be assumed.
Adoption risks in the long term are tightly coupled to the durability of legacy ICE vehicle, aircraft, and ship use. If electrification of road transport proceeds more rapidly than current forecasts (which already incorporate substantial penetration), the legacy ICE fleet shrinks faster, reducing the bridging-demand case for synthetic fuels. Conversely, if electrification stalls (for reasons of charging infrastructure, grid capacity, materials availability, or cost), the case for synthetic fuels strengthens. The two scenarios diverge widely and are difficult to forecast confidently more than five to seven years forward.
9. Strategic Recommendations
9.1 For institutional investors and capital allocators
Treat the sector as a long-duration thematic exposure with binary regulatory dependencies. Construct positions through diversified vehicles or through partnerships with integrators rather than through single-asset bets at the demonstration or first-of-a-kind stage, where the dispersion of operational outcomes is high. Prioritize exposure to component suppliers (electrolyzer manufacturers, DAC technology developers, catalyst suppliers) at the current stage of the sector, where commercial deployment is broader-based than at the integrated-fuels-project level, and where the same technologies serve multiple end-markets including industrial chemicals, hydrogen for ammonia, and direct CO₂ utilization.
Use the following decision triggers to escalate position size. First, the publication of independently verified unit-economics data from at least three first-of-a-kind integrated facilities operating at greater than 70 percent availability. Second, the finalization of EU 2035 e-fuels exemption implementing rules with terms that meaningfully support a passenger-car-fuel demand pool. Third, the establishment of bankable offtake structures (CfDs, long-term-indexed offtake agreements) for at least one project of greater than 200 million liter-per-year capacity. Until these triggers are met, the sector should be assigned a thematic-exposure but not core-allocation weighting in diversified portfolios.
9.2 For corporate strategy executives at energy and mobility firms
Position for optionality through equity stakes, offtake agreements, and joint development arrangements with technology developers, without committing to single-pathway dependence in advance of demonstrated cost convergence. For integrated oil majors, the strategic logic of e-fuels positioning rests on hedging the terminal decline of petroleum demand by maintaining ownership of low-carbon supply substitutes; capital commitments should be proportionate to the option value rather than to current expected returns. For airlines and shipping lines, multi-year, indexed offtake agreements covering 1 to 3 percent of fleet fuel use through 2030 should be negotiated now to secure bankable supply and to provide producers with the demand certainty required to attract project finance.
For automotive OEMs, the strategic implication is more nuanced. Volkswagen, Stellantis, Mazda, and others have made varying public statements about the relevance of e-fuels to their post-2035 product strategy in Europe; the practical importance of these statements depends on the eventual e-fuels exemption rules and on the cost trajectory of synthetic gasoline at retail. Premium OEMs (Porsche, in particular, with its HIF Global stake) have a stronger commercial case than mass-market OEMs because the willingness-to-pay of their customer base accommodates a price premium for fuel. Mass-market OEMs should treat e-fuels as a contingency rather than a primary strategy.
For all corporate strategy positions, build internal life-cycle accounting and certification expertise. The complexity of RFNBO certification, 45V eligibility, CORSIA accounting, and ISCC/RSB scheme selection requires dedicated technical and regulatory capability that most firms outside the dedicated e-fuels space currently lack.
9.3 For policymakers and regulators
Recognize that broad-based subsidies without demand-side anchors will not mobilize private capital at the scale required for sectoral transformation. Prioritize binding sectoral mandates with phased increases, contracts-for-difference for early projects, and harmonized carbon accounting frameworks. The EU approach to RFNBO mandates in aviation and maritime, combined with CfD-style support through the Innovation Fund and the Hydrogen Bank, is a more credible template for accelerating deployment than the U.S. approach of tax-credit-only support, although the latter has lower up-front fiscal cost and may be more politically durable in certain jurisdictions.
Harmonize carbon accounting methodologies across jurisdictions. The current divergence between EU, U.S., UK, and Asian frameworks raises transaction costs for cross-border trade and creates arbitrage opportunities that undermine the integrity of the system. Active engagement through ICAO, IMO, and bilateral cooperation arrangements should be prioritized.
Address the additionality and temporal-matching trade-offs explicitly. Strict additionality rules (as in RED III) protect environmental integrity but raise costs and delay deployment; permissive rules accelerate deployment but allow free-riding on existing renewable generation. The optimum is probably context-dependent (strict for established markets, more permissive for early-stage deployment in emerging markets) but should be set transparently with clear sunset provisions, not implicitly through enforcement discretion.
9.4 For procurement officers at large fuel consumers
Negotiate multi-year, indexed offtake agreements now, while supply is scarce and producers value bankable demand more than premium pricing. The current market is producer-friendly in volume (demand exceeds announced supply) but consumer-friendly in pricing power (because the absence of offtake creates project-finance constraints that producers are willing to address through favorable contract terms). Procurement officers can extract substantial value by combining volume commitment with price indexation that protects both parties: a base price tied to a fossil benchmark plus a premium component, with a floor protecting the producer and a ceiling protecting the buyer.
Diversify supplier geography and technology mix. Aviation procurement strategies that depend on a single producer or a single production geography (concentrated in northwest Europe, for instance, or in southern Chile) are exposed to operational and political risk that diversification can mitigate at modest cost premium. Defense ministries, in particular, should treat synthetic-fuel supply as a strategic capability and structure procurement to develop multiple suppliers, multiple geographies, and multiple production technologies in parallel.
10. Conclusion
The strategic posture supported by the evidence is one of measured engagement under uncertainty. Solar-powered DAC-to-gasoline is technically feasible, economically immature, regulatorily supported in pockets, and competitively positioned to fill a specific and bounded role in the global decarbonization architecture: as the carbon-neutral liquid fuel for applications where direct electrification is impractical and where the cost-tolerance of the end use accommodates a premium. It is not, on the available evidence, a principal pathway for the decarbonization of road transport, where battery electrification has decisive efficiency advantages. It is not a near-term substitute for the great bulk of petroleum demand, where the cost gap is too large and the scaling challenges too substantial.
What the evidence does support is the proposition that synthetic gasoline and its adjacent products (synthetic kerosene, synthetic diesel, synthetic methanol) will be one of several necessary tools in a complete decarbonization toolkit, and that the actors who position themselves credibly in this space during the formative 2025 to 2032 period will exercise disproportionate influence over the eventual architecture of the global low-carbon fuel system. The capital, regulatory, and operational decisions taken in this window will determine which producing geographies emerge as dominant, which technology architectures prevail, and which regulatory frameworks govern a market that may eventually reach hundreds of billions of dollars in annual scale.
The principal posture this report supports is therefore one of structured optionality combined with demand-side anchoring. Investors should expose themselves to the theme through diversified vehicles. Corporate strategists should secure positions across the chain through offtake and equity rather than through unilateral capital commitment. Policymakers should marry tax-credit and grant support with binding sectoral mandates and harmonized accounting standards. Procurement officers should secure supply now, while contract terms favor the buyer. The chain that links sunlight, atmospheric CO₂, water, and the existing liquid-fuels infrastructure is technically sound; its commercial realization will be determined less by chemistry than by the durability of policy commitments, the resolution of regulatory uncertainty, and the integration of demand-side mandates with supply-side innovation.
References
[1] International Energy Agency. 2023. World Energy Outlook 2023. Paris: OECD/IEA.
[2] International Energy Agency. 2023. The Role of E-fuels in Decarbonising Transport. Paris: OECD/IEA.
[3] Ueckerdt, Falko, Christian Bauer, Alois Dirnaichner, Jordan Everall, Romain Sacchi, and Gunnar Luderer. 2021. "Potential and Risks of Hydrogen-Based E-Fuels in Climate Change Mitigation." Nature Climate Change 11 (5): 384–393. doi:10.1038/s41558-021-01032-7.
[4] Concawe. 2022. E-Fuels: A Techno-Economic Assessment of European Domestic Production and Imports towards 2050. Concawe Report 17/22. Brussels: Concawe.
[5] Schmidt, Patrick, Werner Weindorf, Antje Roth, Valentin Batteiger, and Frederik Riegel. 2018. Power-to-Liquids: Potentials and Perspectives for the Future Supply of Renewable Aviation Fuel. Dessau-Roßlau: German Environment Agency (UBA).
[6] Fasihi, Mahdi, Olga Efimova, and Christian Breyer. 2019. "Techno-Economic Assessment of CO2 Direct Air Capture Plants." Journal of Cleaner Production 224: 957–980. doi:10.1016/j.jclepro.2019.03.086.
[7] European Commission. 2023. Directive (EU) 2023/2413 (Renewable Energy Directive III). Official Journal of the European Union L 2413, October 31.
[8] U.S. Internal Revenue Service. 2024. Section 45Q Credit for Carbon Oxide Sequestration: Final Regulations. Treasury Decision 9974. Washington, DC: U.S. Department of the Treasury.
[9] U.S. Department of the Treasury and Internal Revenue Service. 2025. Section 45V Credit for Production of Clean Hydrogen: Final Regulations. Treasury Decision 9999. Washington, DC: U.S. Department of the Treasury.
[10] Climeworks AG. 2024. Mammoth Plant Technical Briefing. Zurich: Climeworks.
[11] Keith, David W., Geoffrey Holmes, David St. Angelo, and Kenton Heidel. 2018. "A Process for Capturing CO2 from the Atmosphere." Joule 2 (8): 1573–1594. doi:10.1016/j.joule.2018.05.006.
[12] 1PointFive. 2023. STRATOS Project Technical Overview. Houston: Occidental.
[13] Steynberg, André, and Mark Dry, eds. 2004. Fischer-Tropsch Technology. Studies in Surface Science and Catalysis, Vol. 152. Amsterdam: Elsevier.
[14] Sasol Limited. 2023. Integrated Report 2023. Johannesburg: Sasol.
[15] Tabak, Samuel A., and Stephen Yurchak. 1990. "Conversion of Methanol over ZSM-5 to Fuels and Chemicals." Catalysis Today 6 (3): 307–327. doi:10.1016/0920-5861(90)85007-B.
[16] HIF Global. 2024. Haru Oni eFuels Demonstration Plant: Technical and Commercial Briefing. Santiago: HIF Global.
[17] International Renewable Energy Agency. 2024. Renewable Power Generation Costs in 2023. Abu Dhabi: IRENA.
[18] Global CCS Institute. 2023. Global Status of CCS 2023. Melbourne: Global CCS Institute.
[19] International Energy Agency. 2022. Direct Air Capture: A Key Technology for Net Zero. Paris: OECD/IEA.
[20] Beuttler, Christoph, Louise Charles, and Jan Wurzbacher. 2019. "The Role of Direct Air Capture in Mitigation of Anthropogenic Greenhouse Gas Emissions." Frontiers in Climate 1: 10. doi:10.3389/fclim.2019.00010.
[21] Daniel, Tara, Tyler Masuda, Habib Alkhaldi, Roxana Trout, and Howard Herzog. 2022. "Techno-Economic Analysis of Direct Air Carbon Capture with CO2 Utilization." Carbon Management 13 (1): 357–377. doi:10.1080/17583004.2022.2104747.
[22] McQueen, Noah, Katherine Vaz Gomes, Colin McCormick, Katherine Blumanthal, Maxwell Pisciotta, and Jennifer Wilcox. 2021. "A Review of Direct Air Capture (DAC): Scaling Up Commercial Technologies and Innovating for the Future." Progress in Energy 3 (3): 032001. doi:10.1088/2516-1083/abf1ce.
[23] National Academies of Sciences, Engineering, and Medicine. 2019. Negative Emissions Technologies and Reliable Sequestration: A Research Agenda. Washington, DC: National Academies Press. doi:10.17226/25259.
[24] International Renewable Energy Agency. 2020. Green Hydrogen Cost Reduction: Scaling Up Electrolysers to Meet the 1.5°C Climate Goal. Abu Dhabi: IRENA.
[25] International Energy Agency. 2023. Global Hydrogen Review 2023. Paris: OECD/IEA.
[26] Buttler, Alexander, and Hartmut Spliethoff. 2018. "Current Status of Water Electrolysis for Energy Storage, Grid Balancing and Sector Coupling via Power-to-Gas and Power-to-Liquids: A Review." Renewable and Sustainable Energy Reviews 82: 2440–2454. doi:10.1016/j.rser.2017.09.003.
[27] Schmidt, Oliver, Adam Gambhir, Iain Staffell, Ajay Hawkes, Jenny Nelson, and Sheridan Few. 2017. "Future Cost and Performance of Water Electrolysis: An Expert Elicitation Study." International Journal of Hydrogen Energy 42 (52): 30470–30492. doi:10.1016/j.ijhydene.2017.10.045.
[28] Hauch, Anne, Rainer Küngas, Peter Blennow, Anders B. Hansen, John B. Hansen, Bengt V. Mathiesen, and Mogens B. Mogensen. 2020. "Recent Advances in Solid Oxide Cell Technology for Electrolysis." Science 370 (6513): eaba6118. doi:10.1126/science.aba6118.
[29] Davis, Burtron H., and Mario L. Occelli, eds. 2010. Advances in Fischer-Tropsch Synthesis, Catalysts, and Catalysis. Boca Raton: CRC Press.
[30] Dieterich, Vincent, Andreas Buttler, Andreas Hanel, Hartmut Spliethoff, and Sebastian Fendt. 2020. "Power-to-Liquid via Synthesis of Methanol, DME or Fischer-Tropsch Fuels: A Review." Energy and Environmental Science 13 (10): 3207–3252. doi:10.1039/D0EE01187H.
[31] Marlin, David S., Eric Sarron, and Óscar Sigurbjörnsson. 2018. "Process Advantages of Direct CO2-to-Methanol Synthesis." Frontiers in Chemistry 6: 446. doi:10.3389/fchem.2018.00446.
[32] Olsbye, Unni, Stian Svelle, Morten Bjørgen, Pablo Beato, Ton V. W. Janssens, Finn Joensen, Silvia Bordiga, and Karl P. Lillerud. 2012. "Conversion of Methanol to Hydrocarbons: How Zeolite Cavity and Pore Size Controls Product Selectivity." Angewandte Chemie International Edition 51 (24): 5810–5831. doi:10.1002/anie.201103657.
[33] U.S. Department of Energy. 2020. Hydrogen Storage Technical Targets. Washington, DC: U.S. DOE Hydrogen and Fuel Cell Technologies Office.
[34] Joint Research Centre (European Commission). 2023. Towards Net-Zero Emissions in the EU Energy System by 2050. Luxembourg: Publications Office of the European Union.
[35] Tonelli, Davide, Lorenzo Rosa, Paolo Gabrielli, Andreas Caldera, Konstantin Andresen, and Marco Mazzotti. 2023. "Global Land and Water Limits to Electrolytic Hydrogen Production Using Wind and Solar Resources." Nature Communications 14: 5532. doi:10.1038/s41467-023-41107-x.
[36] International Energy Agency. 2023. The Role of Critical Minerals in Clean Energy Transitions. Paris: OECD/IEA.
[37] Heirloom Carbon. 2023. Tracy California Facility: Technical Briefing. San Francisco: Heirloom Carbon Technologies.
[38] Norsk e-Fuel AS. 2024. Mosjøen Power-to-Liquid Facility: Technical and Commercial Briefing. Oslo: Norsk e-Fuel.
[39] Infinium. 2024. Project Roadrunner Technical Briefing. Sacramento: Infinium.
[40] Twelve. 2024. AirCompany E-Jet Production Briefing. Berkeley: Twelve Benefit Corporation.
[41] Prometheus Fuels. 2023. Annual Technical Update. Santa Cruz: Prometheus Fuels.
[42] CarbonCapture Inc. 2023. Project Bison Technical Briefing. Pasadena: CarbonCapture Inc.
[43] BloombergNEF. 2024. 1H 2024 Hydrogen Market Outlook. New York: BloombergNEF.
[44] Porsche AG. 2022. Investor and Strategic Review: HIF Global Investment. Stuttgart: Porsche.
[45] Synhelion. 2023. DAWN Facility Technical Briefing. Lugano: Synhelion.
[46] Repsol. 2024. Petronor Synthetic Fuels Plant: Technical Briefing. Madrid: Repsol.
[47] International Air Transport Association. 2024. SAF Production Outlook and Industry Tracker. Montreal: IATA.
[48] World Economic Forum and McKinsey & Company. 2023. Clean Skies for Tomorrow: Sustainable Aviation Fuels Industry Progress Report. Geneva: WEF.
[49] European Parliament and Council. 2023. Regulation (EU) 2023/851 Amending CO2 Emission Performance Standards for New Passenger Cars and Light Commercial Vehicles. Official Journal of the European Union L 110, April 25.
[50] U.S. Department of Energy. 2023. Regional Direct Air Capture Hubs Program Notice of Funding Opportunity. Washington, DC: U.S. DOE Office of Clean Energy Demonstrations.
[51] U.S. Department of Energy. 2023. Regional Clean Hydrogen Hubs Program Awards. Washington, DC: U.S. DOE Office of Clean Energy Demonstrations.
[52] European Commission. 2024. Innovation Fund: Third Call for Large-Scale Projects Results. Brussels: DG CLIMA.
[53] European Commission. 2024. European Hydrogen Bank Second Auction Terms and Conditions. Brussels: CINEA.
[54] Hintco GmbH. 2024. H2Global Mechanism: First Pilot Auction Results. Hamburg: H2Global Foundation.
[55] Ministry of Economy, Trade and Industry (Japan). 2023. Basic Hydrogen Strategy (Revised). Tokyo: METI.
[56] ISCC System GmbH. 2024. ISCC EU and ISCC Plus System Documents (200-1, 201-1). Cologne: ISCC.
[57] Roundtable on Sustainable Biomaterials. 2023. RSB Power-to-X Fuels Standard. Geneva: RSB.
[58] International Civil Aviation Organization. 2024. CORSIA Eligible Fuels and Default Life Cycle Emissions Values. Montreal: ICAO.
[59] California Air Resources Board. 2024. Low Carbon Fuel Standard Regulation: Final Rulemaking Documents. Sacramento: CARB.
[60] Sens, Lukas, Ulf Neuling, and Martin Kaltschmitt. 2024. "Capital Expenditure and Levelized Cost of Electricity of Photovoltaic Plants and Wind Turbines: Development by 2050." Renewable Energy 224: 119663. doi:10.1016/j.renene.2024.119663.
[61] Sacchi, Romain, Viktor Becattini, Paolo Gabrielli, Brian Cox, Andreas Dirnaichner, Christian Bauer, and Marco Mazzotti. 2024. "How to Make Climate-Neutral Aviation Fly." Nature Communications 14: 3989. doi:10.1038/s41467-023-39749-y.
[62] U.S. Energy Information Administration. 2024. Short-Term Energy Outlook January 2024. Washington, DC: U.S. EIA.
[63] International Council on Clean Transportation. 2023. Total Cost of Ownership of Electric and Internal Combustion Vehicles: 2023 Update. Washington, DC: ICCT.
[64] International Energy Agency. 2023. Renewables 2023: Analysis and Forecast to 2028. Paris: OECD/IEA.
[65] European Parliament and Council. 2023. Regulation (EU) 2023/2405 on the Use of Renewable and Low-Carbon Fuels in Air Transport (ReFuelEU Aviation). Official Journal of the European Union L 2405.
[66] European Parliament and Council. 2023. Regulation (EU) 2023/1805 on the Use of Renewable and Low-Carbon Fuels in Maritime Transport (FuelEU Maritime). Official Journal of the European Union L 1805.
[67] International Energy Agency. 2023. Net Zero Roadmap: A Global Pathway to Keep the 1.5 °C Goal in Reach (2023 Update). Paris: OECD/IEA.
[68] Glenk, Gunther, and Stefan Reichelstein. 2022. "Reversible Power-to-Gas Systems for Energy Conversion and Storage." Nature Communications 13: 2010. doi:10.1038/s41467-022-29520-0.
[69] U.S. Internal Revenue Service. 2024. Notice 2025-10: Section 45Z Clean Fuel Production Credit Guidance. Washington, DC: U.S. Department of the Treasury.
[70] Bipartisan Policy Center. 2025. Inflation Reduction Act Implementation Tracker: Mid-2025 Update. Washington, DC: Bipartisan Policy Center.
[71] International Renewable Energy Agency. 2023. Innovation Outlook: Renewable Methanol. Abu Dhabi: IRENA.
[72] Korea Energy Economics Institute. 2024. Korea Hydrogen Economy Outlook 2024. Ulsan: KEEI.
[73] Ministry of Energy (Chile). 2023. National Green Hydrogen Action Plan. Santiago: Ministerio de Energía.
[74] NEOM Green Hydrogen Company. 2023. Project Technical and Financial Briefing. Tabuk: NEOM.
[75] Australian Renewable Energy Agency. 2023. Australia's National Hydrogen Strategy: 2023 Review. Canberra: ARENA.
[76] United Kingdom Department for Transport. 2024. Sustainable Aviation Fuel Mandate: Final Policy Documents. London: DfT.
[77] Centre for Strategic and International Studies. 2023. The Geopolitics of Green Hydrogen and E-fuels: Power, Prosperity, and Politics. Washington, DC: CSIS.
[78] European Commission, Directorate-General for Climate Action. 2024. EU ETS Allowance Auction Results: 2024 Annual Report. Brussels: DG CLIMA.